Visualizing Weather Research and Forecasting Telescopic Nesting with ParaView

Note: this is a guest blog from Marco Miani from GEA Computing – Through Numbers, the Earth.
Telescoping nesting of subdomains in Weather Research and Forecasting (WRF) refers to the capability of the model to use multiple levels of nested grids to represent fine-scale features within larger-scale domains. This allows for a more detailed representation of complex atmospheric processes while maintaining computational efficiency.
The nested grids in WRF can be configured to cover different spatial scales, with each nested domain providing higher resolution than its parent domain. This enables the model to capture local weather phenomena such as thunderstorms, while also simulating larger-scale weather patterns.
Overall, the telescoping nesting of subdomains in the WRF model enhances its ability to simulate a wide range of atmospheric phenomena with high spatial resolution, making it a valuable tool for weather research and forecasting.
Why Telescopic Nesting?
Telescopic nesting in the WRF model, or the use of multiple levels of nested grids with increasing spatial resolution, offers several advantages for simulating atmospheric processes:
- High-Resolution Representation: Telescopic nesting allows for the representation of fine-scale atmospheric features and localized phenomena within larger-scale domains. This is essential for capturing complex weather patterns, such as convective storms, mountain-induced circulations, and coastal processes, with high spatial resolution.
- Computational Efficiency: By using nested domains with varying spatial resolutions, the model can focus computational resources where they are most needed. Higher resolution is applied only in specific regions of interest, while coarser resolution is used in surrounding areas. This approach optimizes computational efficiency while maintaining detailed representation of important features.
- Seamless Information Transfer: Telescopic nesting facilitates the transfer of meteorological information between different spatial scales. By nesting finer grids within coarser ones, the model can pass detailed information from larger-scale domains (parent or “mother” domain) to smaller-scale domains (“child” domain), ensuring consistency and continuity in the simulation.
- Flexibility and Adaptability: The use of telescopic nesting provides flexibility to tailor the spatial resolution of the model to the specific requirements of the simulation. It allows meteorologists and researchers to focus on different scales of atmospheric phenomena and adapt the model’s resolution to the needs of their studies or forecasting applications.
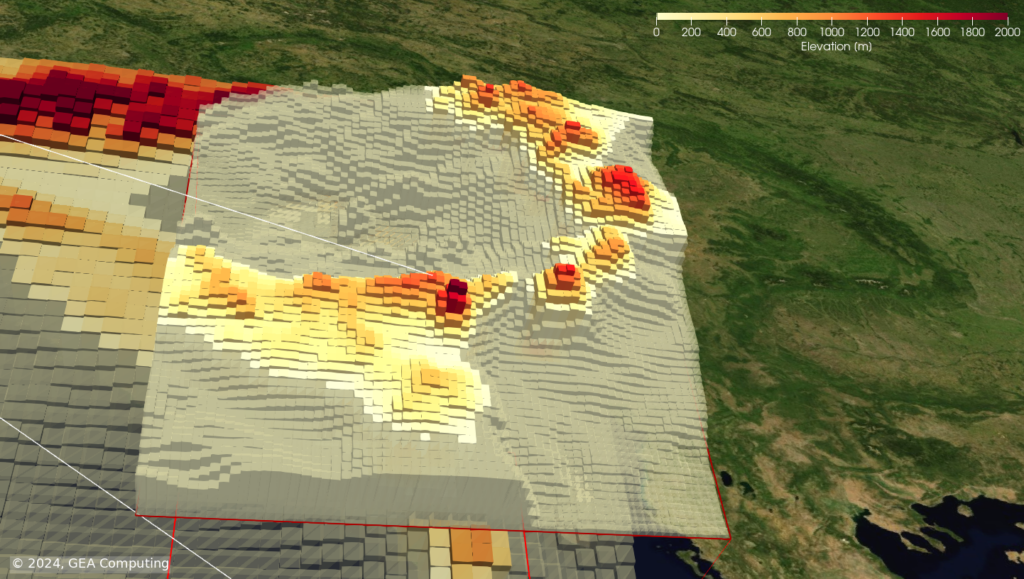
Telescopic Nesting Visualization with ParaView
To effectively demonstrate and visualize the concept of telescopic nesting, three (sub-)domains are displayed as follows:
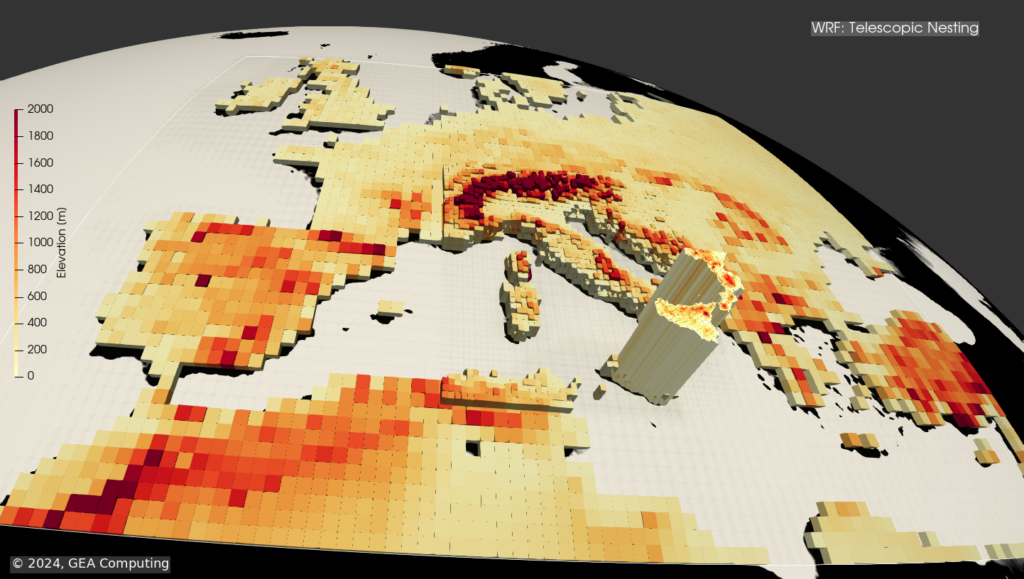
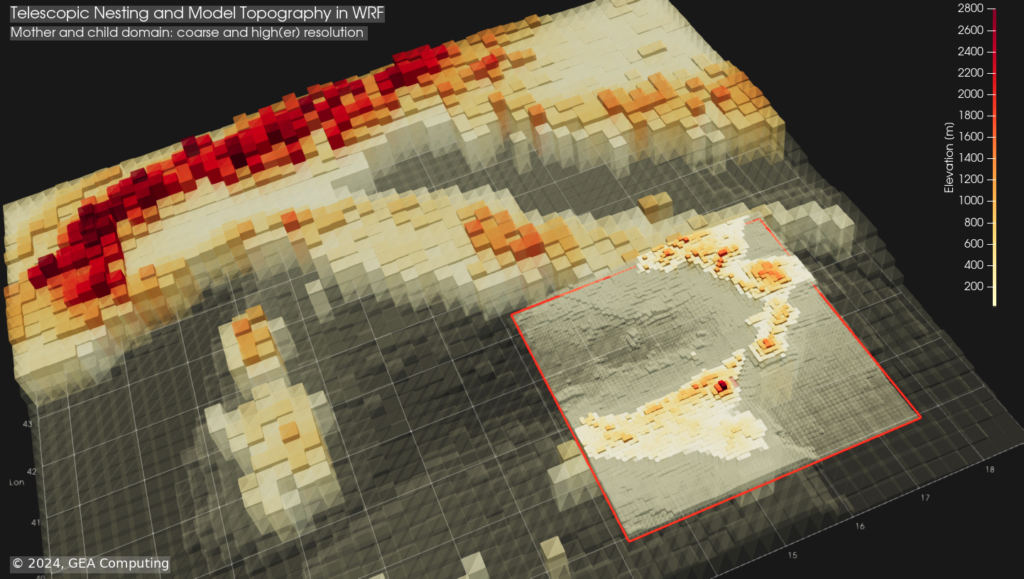
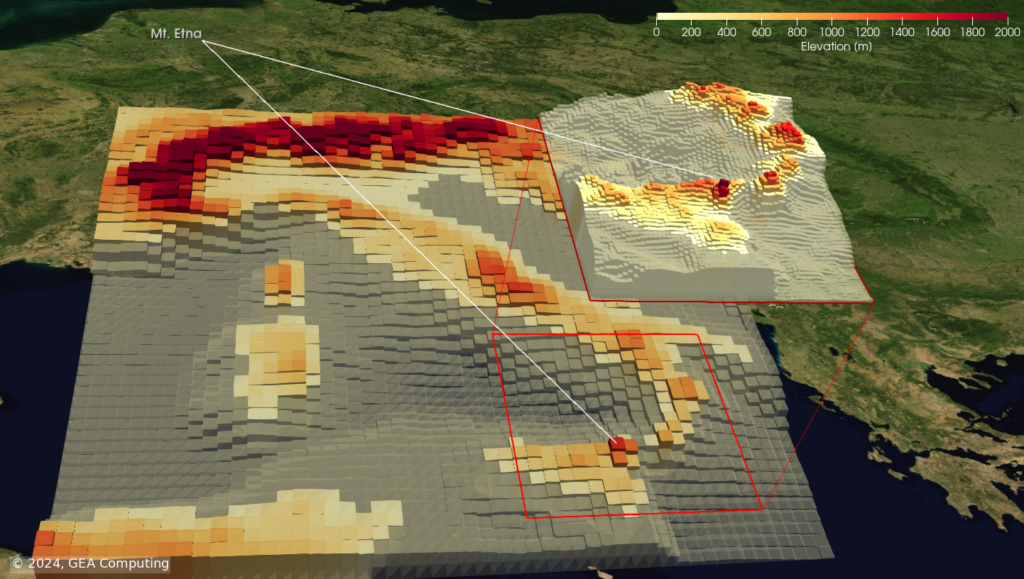
- The coarsest domain represents the regional-scale computational grid, supplying boundary conditions to its children and enclosing nested domains. In this case, the parent domain encompasses most of the European Region.
- The intermediate domain (Italian peninsula), with an intermediate resolution, acts as a numerical conduit for transmitting information to the ultimate, highly resolved end.
- The final link in the chain (Mount Etna in Sicily) depicts the highest resolution, permitting the capture of topographic and meteorological features to be explored through the simulation.
The data is displayed in both the planar and spherical coordinate systems. In each case, the more highly resolved domains stand out more prominently from the background scene, providing a clearer insight and understanding of the concepts described above. To accomplish this outcome, the “Extrusion surface” feature was utilized and applied to all three domains, along with the extrusion factor to regulate the prominence of the extrusion.
To simulate both coarser and finer domains, GEBCO bathymetric data (https://www.gebco.net/) was obtained and processed through decimation. Typically, nested model output have a different spatial resolution, where the “parent” or “mother” domain (outer domain) is coarser, and the “child” domain (inner, nested) is higher. Here, instead of using actual model results (e.g., air temperature, pressure, wind speed), the mere topography was used to illustrate the intricacy of this interconnected mosaic, demonstrating how all these pieces end up coming together.
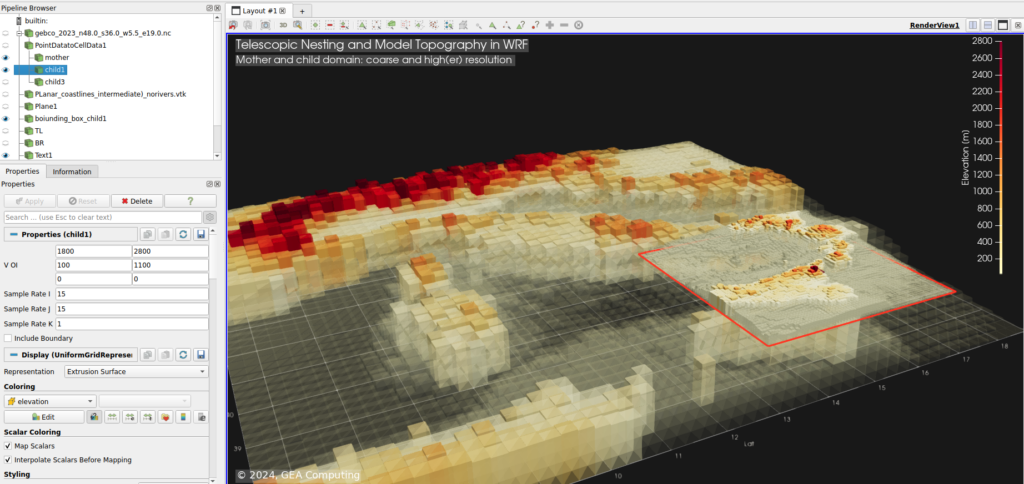
A smooth rolling filter with the appropriate width was then applied to illustrate the effect of refinement or coarsening.
Conclusions
ParaView is an exceptional tool for producing high-quality images of complex data structures, especially in the fields of geo-data and climate data. With minimal effort, it enables the creation of clear and concise images to effectively convey complex messages and concepts. Its built-in capabilities, including customization options via Python and VTK, offer a high degree of flexibility.
ParaView is not only known for its traditional applications in fields such as CFD and biomedical visualization, but it also stands out as a powerful tool for effectively visualizing complex climate data. Its ability to transform intrinsically complex climate data into a clear, understandable, and impactful representation makes it an invaluable tool for the general public as well.
GEA Computing
At GEA Computing, we are dedicated to scientific data visualization, particularly with open-source software from Kitware. The excitement of science and the ability of computers and numerical machines to recreate the physical world and its dynamics is a driving force for scientists of all ages. Our mission is to transform science into visually appealing and easily understandable concepts. We believe that science is not only about what we know, but also about how we effectively communicate and convey that knowledge: Through numbers, the Earth – as our motto says.
More animations and examples (also with ParaView) available at: https://www.gea-computing.eu/visualization/