Using the Color Map Editor in ParaView – The Basics

One of the first things that any visualization tool user does when he (or she) opens up a new dataset and looks at the mesh is to color the mesh with some scalar data. Color mapping is a common visualization technique that maps data to colors, and displays the colors in the rendered image. Of course, to map the data array to colors, we use a transfer function. A transfer function can also be used to map the data array to opacity for rendering translucent surfaces or for volume rendering. The UI that allows the user to edit these transfer functions has been redesigned for ParaView 4.1. This post discusses how to use this new Color Map Editor.
This post focuses on the basics. In the subsequent posts, we will cover the annotations and using categorical color maps.
The Basics
If you’ve used ParaView for a while, you can skip this section. It may either have been too obvious or you may have learnt it the hard way, in any case, you couldn’t have not realized this if you have been doing serious visualizations with ParaView. For the rest, here’s a quick overview of how color transfer functions are managed in ParaView.
ParaView associates a transfer function with the data array identified by its name and number of components. The same transfer function is used when coloring with the same array in different 3D views, or results from different stages in the pipeline.
There are separate transfer functions for color and opacity. The opacity transfer function is optional when doing surface renderings (one can turn it on/off by using the Color Map Editor as explained later), but gets used when volume rendering.
The Color Map Editor panel is now a dockable panel, and not a popup dialog as with previous versions of ParaView. To can toggle the visibility of the panel by selecting the “Color Map Editor” option from the View menu. Additionally, any other UI elements that allow users to edit the color mapping now show this panel e.g. the Edit Color Map button in the toolbar, or the Properties panel.
The Panel

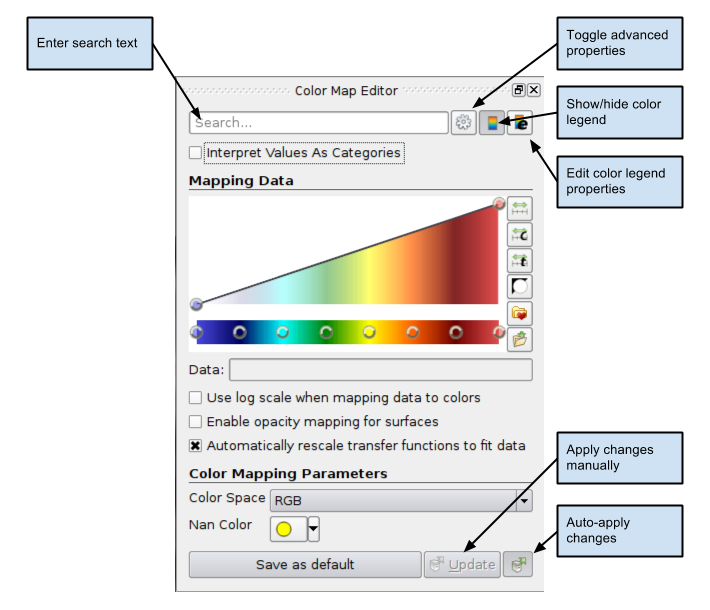
Figure 1: Color Map Editor Panel
Similar to the Properties panel, by default, the commonly used properties are shown. One can toggle the visibility of advanced properties by using the button labelled Toggle advanced properties in Figure 1. Additionally, one can search for a particular property by typing its name in the Search box.
Whenever the transfer function is changed, we need to re-render which may be time consuming. Hence, by default, changes made on this panel do not trigger an update until the user hits the Update button. To automatically update after changes, one can check the push-button labelled Auto-apply changes. The button’s state is remember across sessions, similar to Apply button on the Properties panel.
The Save as default button can be used to make the current color and opacity transfer function with all its properties to be the default that ParaView will use next time it needs to setup a transfer function to color a new data array. Note that this will not affect any already colors data arrays. Also this is saved across sessions, so ParaView will remember this even after restart.
Mapping Data

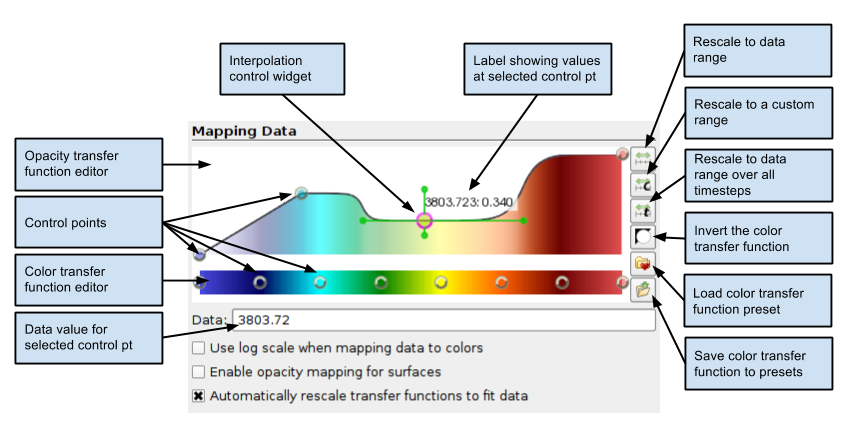
Figure 2: Transfer Function Editor and related properties
To map the data to color using a log scale, rather than a linear scale, check the Use log scale when mapping data to colors. It is assumed that the data is in the non-zero, positive range. ParaView will report errors and try to automatically fix the range if it’s ever invalid for log mapping.
Based on the user preference set in the Settings dialog, ParaView can automatically rescale the transfer function every time when the user hits the “Apply” on the properties panel, or when the time step changes. This behavior can be disabled by unchecking the Automatically rescale transfer functions to fit data checkbox.
Transfer Function Editor
Using the transfer function editors is pretty straight forward. Control points in the opacity editor widget and the color editor widget are independent of each other. To select a control point, click on it. When selected, the control point is highlighted with a red circle and data value associated with the control point is shown in the Data input box under the widget. Clicking in an empty area will add a control point at that location. To move a control point, click on the control point and drag it. One can fine tune the data value associated with the selected control point using the Data input box. To delete a control point, select the control point and then hit the Del key. Note that the mouse pointer should be within the transfer function widget for Qt to send the event to the editor widget correctly. The end control points cannot be moved or deleted, however. One can rescale the entire transfer function to move the control points as explained later.
In the opacity transfer function widget, one can move the control points vertically to control the opacity value associated with that control point. In the color transfer function widget, one can double click on the control point to pop up a color chooser widget to set the color associated with that control point.
The opacity transfer function widget also offers some control over the interpolation between the control points. Double click on a control point to show the interpolation control widget which allows changing the sharpness and midpoint which affect the interpolation. Click and drag the control points to see the change in interpolation.
The several control buttons on the right side of the transfer function widgets support the following actions:
- Rescale to data range: Rescales the color and opacity transfer functions using the data range from the data source selected in the Pipeline browser i.e. the active source. This rescale the entire transfer function, thus all control points including the intermediate ones and proportionally adjusted to fit the new range.
- Rescale to custom range: Rescales the color and opacity transfer functions using a range provided by the user. A dialog will be popped up for the user to enter the custom range.
- Invert color transfer function: Inverts the color transfer function by moving the control points e.g. a red-to-green transfer function will be inverted to a green-to-red. This only affects the color transfer function, and leaves the opacity transfer function untouched.
- Load color transfer function preset: Load the color transfer function from a preset. Color present manager dialog popped up allows the user to load presets from file, if needed. Currently, this only supports the color transfer function, but in the future, it will be extended to support the opacity transfer function as well.
- Save color transfer function to presets: Save the current color transfer function to presets. Color present manager dialog popped up allows the user to export the transfer function to a file, if needed. Currently, this only supports the color transfer function, but in the future, it will be extended to support the opacity transfer function as well.
Color Mapping Parameters

Figure 3: Color Mapping Parameters (showing advanced properties as well)
Still to come…
In the subsequent posts, we will cover using annotations in the color legend to explicitly control the labels shown on the color legend and using categorical color maps for discrete coloring.
My MacBook doesn’t have a Del key, and Cmd + BackSpace doesn’t seem to do the trick. Any ideas how to delete colour points in this case?