trame: Dashboard Use Case
trame
Kitware’s trame [1] platform is designed to spark creativity and empower developers to build compelling interactive visual applications that can be accessed directly through web browsers. trame, a Python package, serves as a conduit for building robust applications without necessitating extensive web development proficiency. Its remarkable versatility allows for the creation of desktop applications, Jupyter tools, HPC applications, and client/server cloud applications for various devices such as phones, tablets, laptops, and desktops, without the need for any code modifications. Check out our first blog in this series for in-depth information on trame: “trame: Architecture and Capabilities” [2].
Dashboards
A dashboard is an analysis and visualization tool that provides at-a-glance views of data and information, especially key metrics or performance indicators, that drive organizational decision-making processes. It combines several interactive reports and is becoming the most common visualization application.
There are three main types of dashboards:
- Operational for displaying real-time data
- Strategic for showing patterns and trends over time
- Analytical for more advanced analytics
trame shines in producing science and engineering dashboards that often have three-dimensional (3D) visualizations.

trame leverages existing widgets and visualization libraries and tools to create vivid content for visual analytics applications.
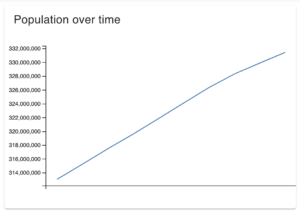
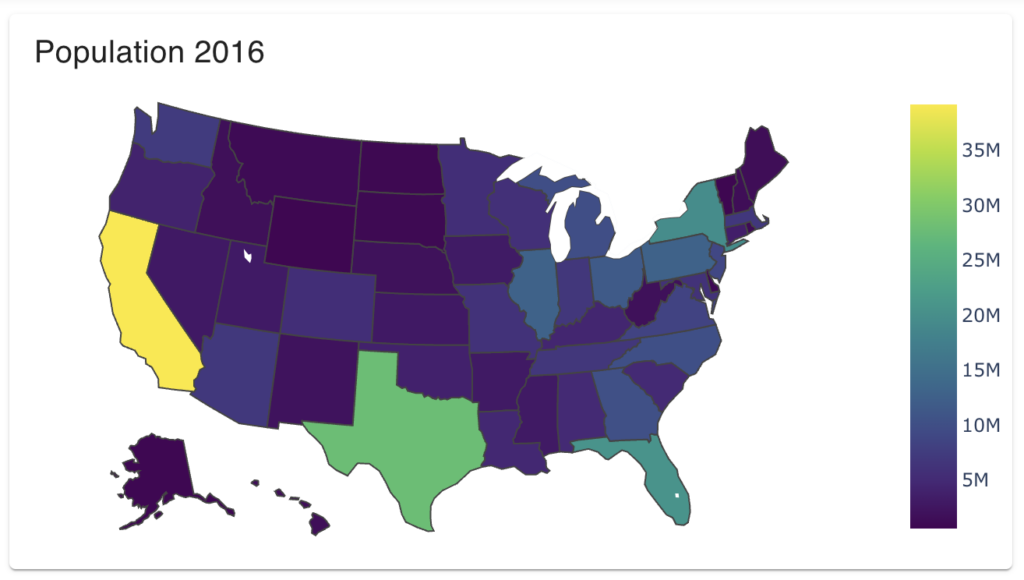
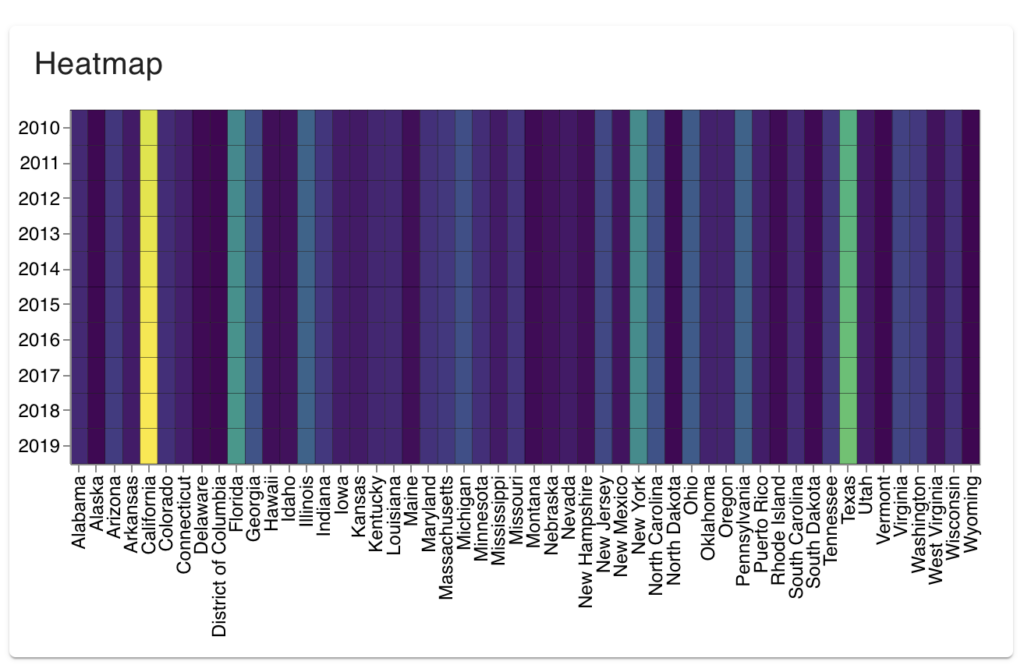
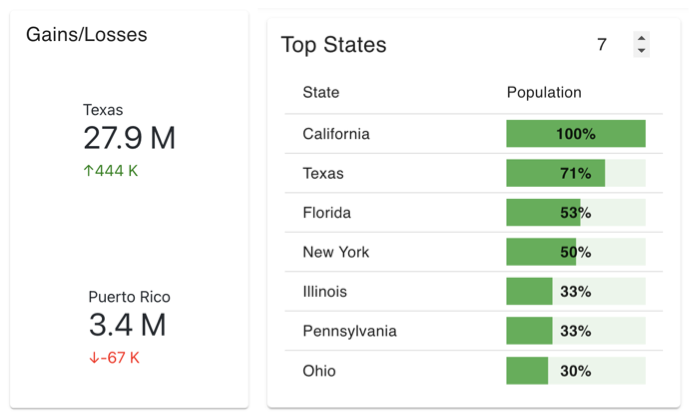
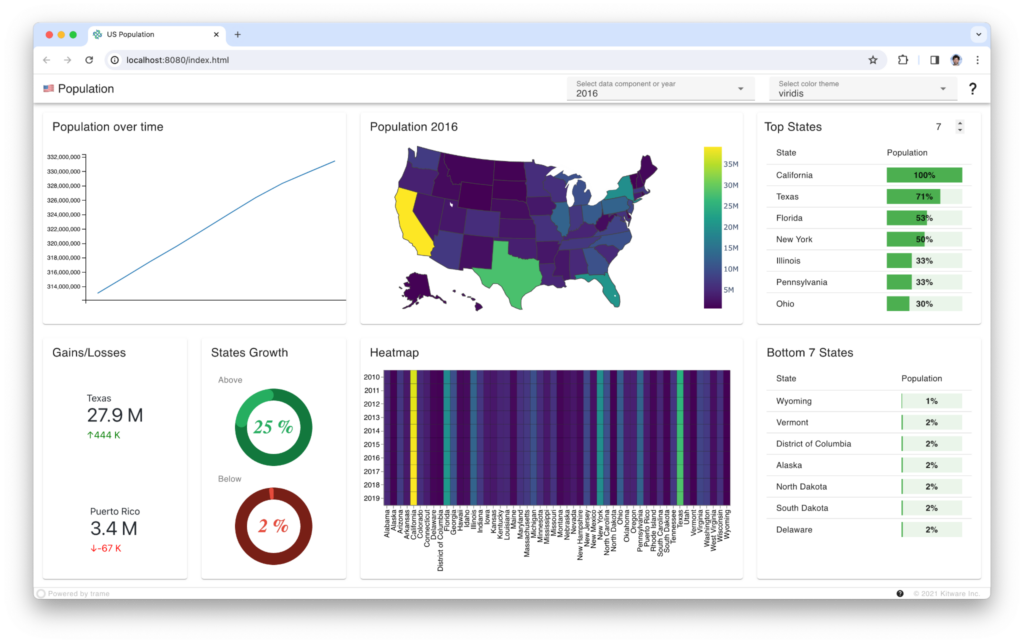
Figure: U.S. population (a) a MatPlotLib growth chart over time, (b) a Plotly choropleth map for 2016, (c) an Altair Vega plot of year versus state, (d) a Markdown plot of states with the great gains and losses, and (e) a Vuetify progress plot of top states.
Big Data, often compared to new oil, requires refining and processing for effective utilization. Data from various sources can create scientific and engineering dashboards and powerful tools, making data easily accessible and understandable and empowering end-users with visual representations of key information.
Dashboards are essential tools in various scientific and engineering endeavors, and trame supports creating dashboards by organizations, including the Nuclear Energy Advanced Modeling and Simulation (NEAMS) program of the U.S. Department of Energy-Office of Nuclear Energy (DOE-NE).
The NEAMS program develops advanced modeling and simulation tools and capabilities to expedite the deployment of advanced nuclear energy technologies, including light-water reactors (LWRs), non-light-water reactors (non-LWRs), and advanced fuels. One of the NEAMS Toolkit codes is the Virtual Environment for Reactor Analysis (VERA). VERA is the NEAMS LWR multiphysics code suite. It integrates physics components based on science-based models and state-of-the-art numerical methods (see https://vera.ornl.gov/ and https://neams.inl.gov/).
We have innovatively created a trame-based science and engineering dashboard for VERA called VERACore [4], a tool that holds immense potential in the analysis and visualization of VERA results as researchers search for solutions and insights for the design, operation, safety, and performance optimization of current and future nuclear light-water reactors.
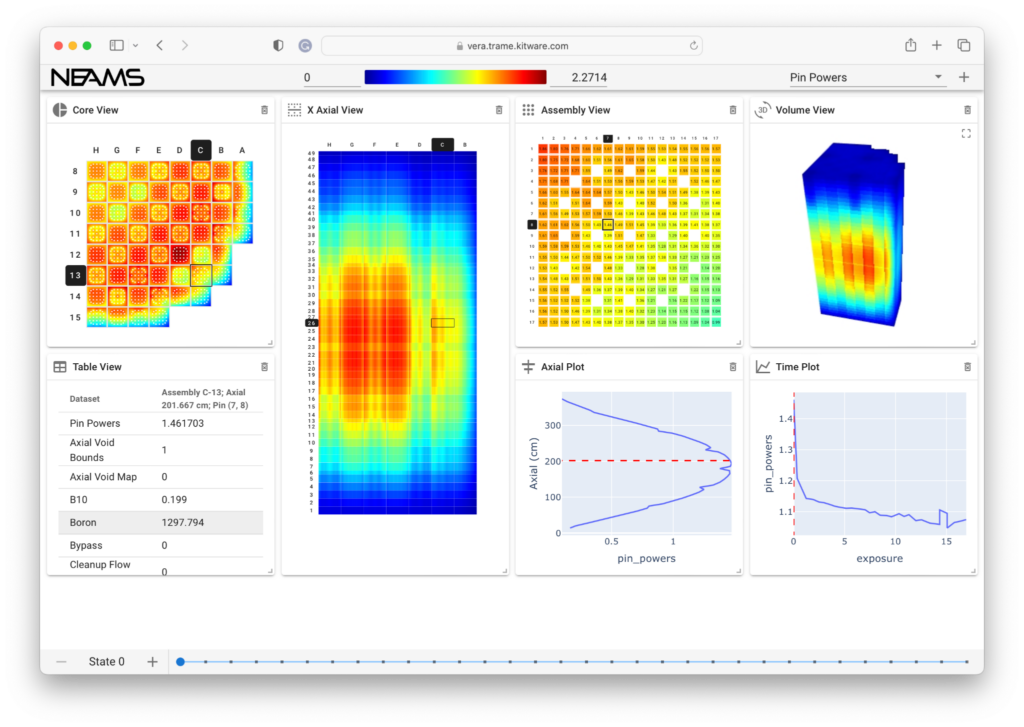
VERACore leverages existing widget and visualization libraries and tools like Vuetify and Plotly.
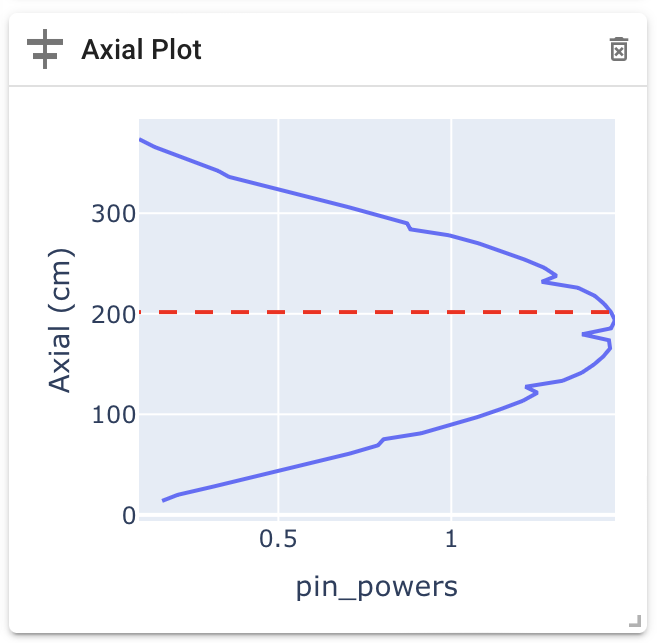
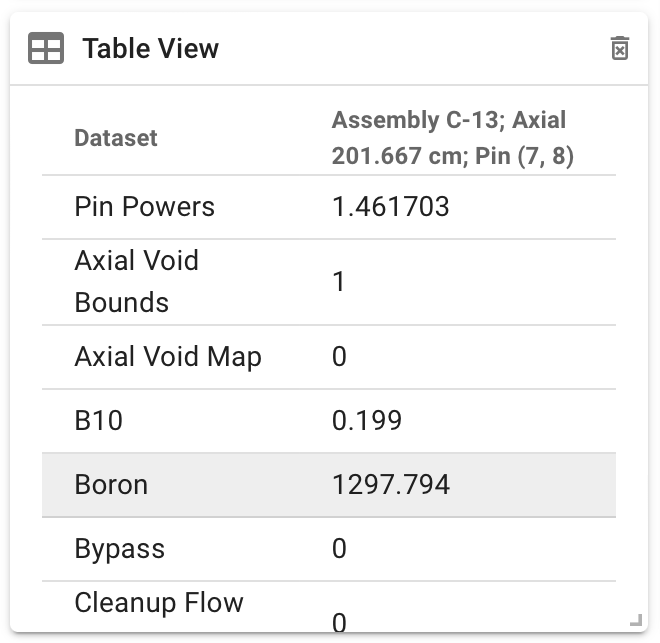
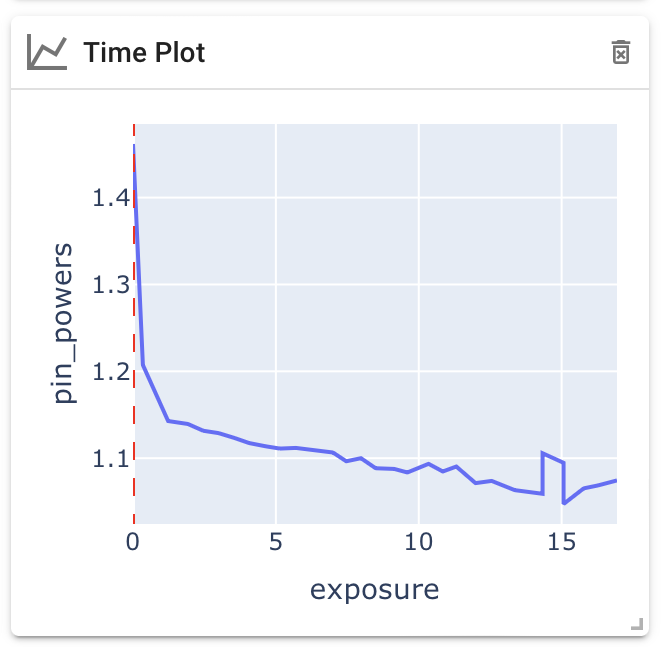
Figure: (a) a Plotly axial plot component, (b) a Vuetify Table component, and (c) a Plotly time plot.
VERACore utilizes VTK for 3D volume visualization views.
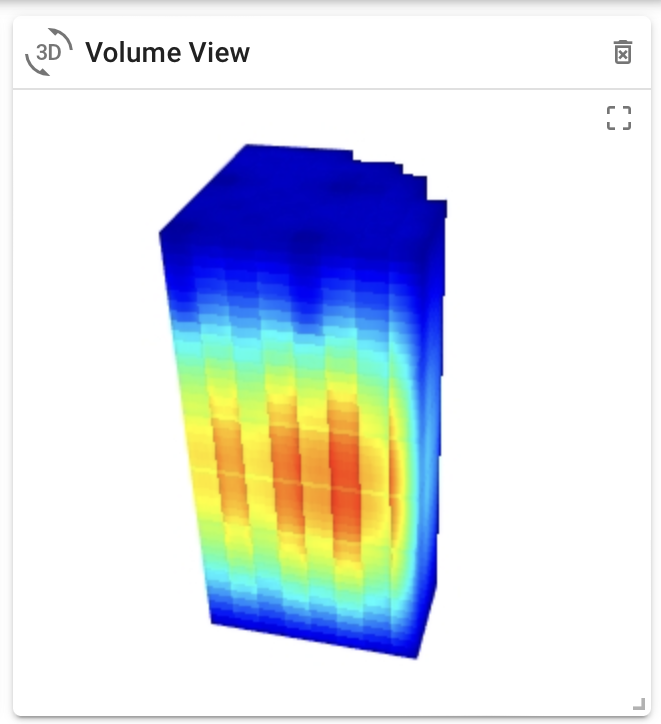
If necessary or desired, trame allows for the creation and seamless integration of specialized components based on HTML/CSS, Vue, and more. VERACore uses sophisticated custom widgets to navigate these massive data sets from core view down to pellet view.
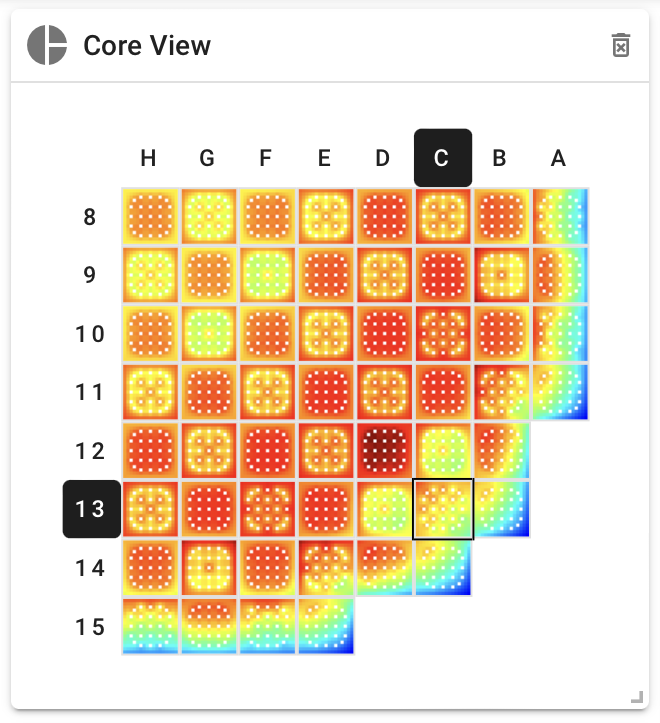
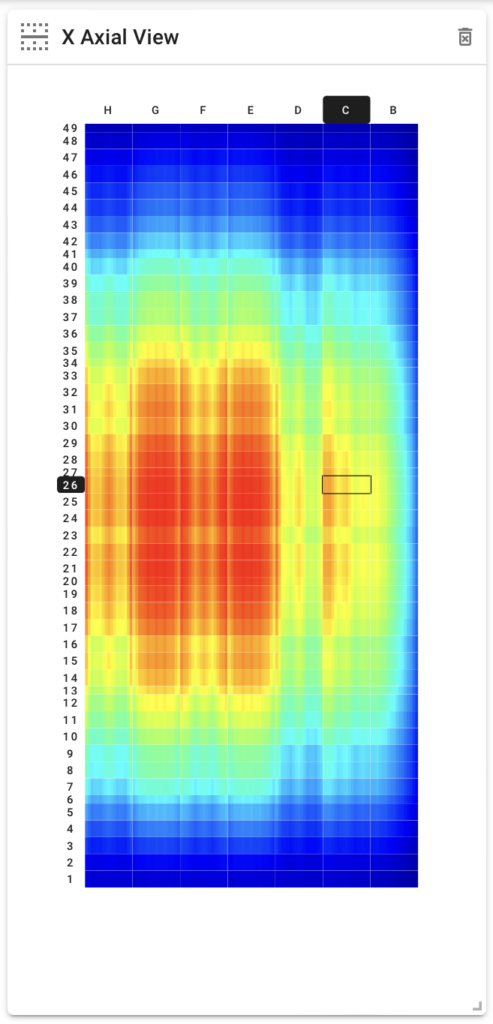
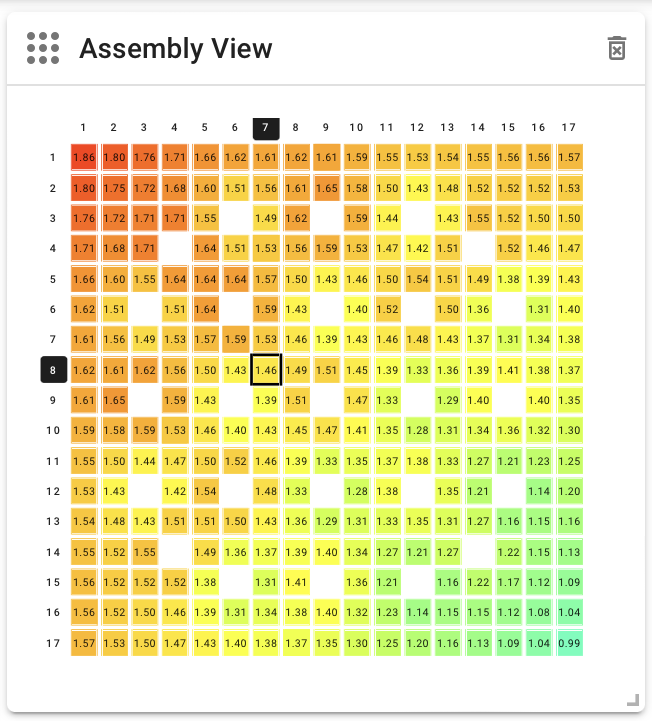
Figure: Custom navigational widgets (a) core view for assembly navigation, (b) axial view for vertical navigation, and (c) assembly view for pin/pellet navigation.
Support and Services
Looking to take your application to new heights? Get in touch with Kitware for expert development and support services and fast-track your success with trame.


Support
Our experts can assist your team as you build your web application and establish in-house expertise.
Get Support
Custom Development
Leverage Kitware’s 25+ years of experience to quickly build your web application.
Request a QuoteReferences
[1] trame, Software Package, Ver. 3.6.0, Kitware, Inc., Clifton Park, NY, 2024. https://kitware.github.io/trame/, DOI 10.5281/zenodo.10957638
[2] trame: trame: Architecture and Capabilities, June 15, 2024. https://www.kitware.com/trame-architecture-and-capabilities/
[3] Heidari, Z., and Posenato Garcia, A., “Austin Chalk”, Digital Rocks Portal, 2016. [Online]. Available: http://www.digitalrocksportal.org. [Assessed: 24-May-2024]
[4] Avery, P., Jourdain, S., O’Leary, P., and Schroeder, W., VERACore: trame in Application, January 18, 2023. https://www.kitware.com/veracore-trame-in-application/