Tomviz 1.3: Pipelines, State, and Live Updates

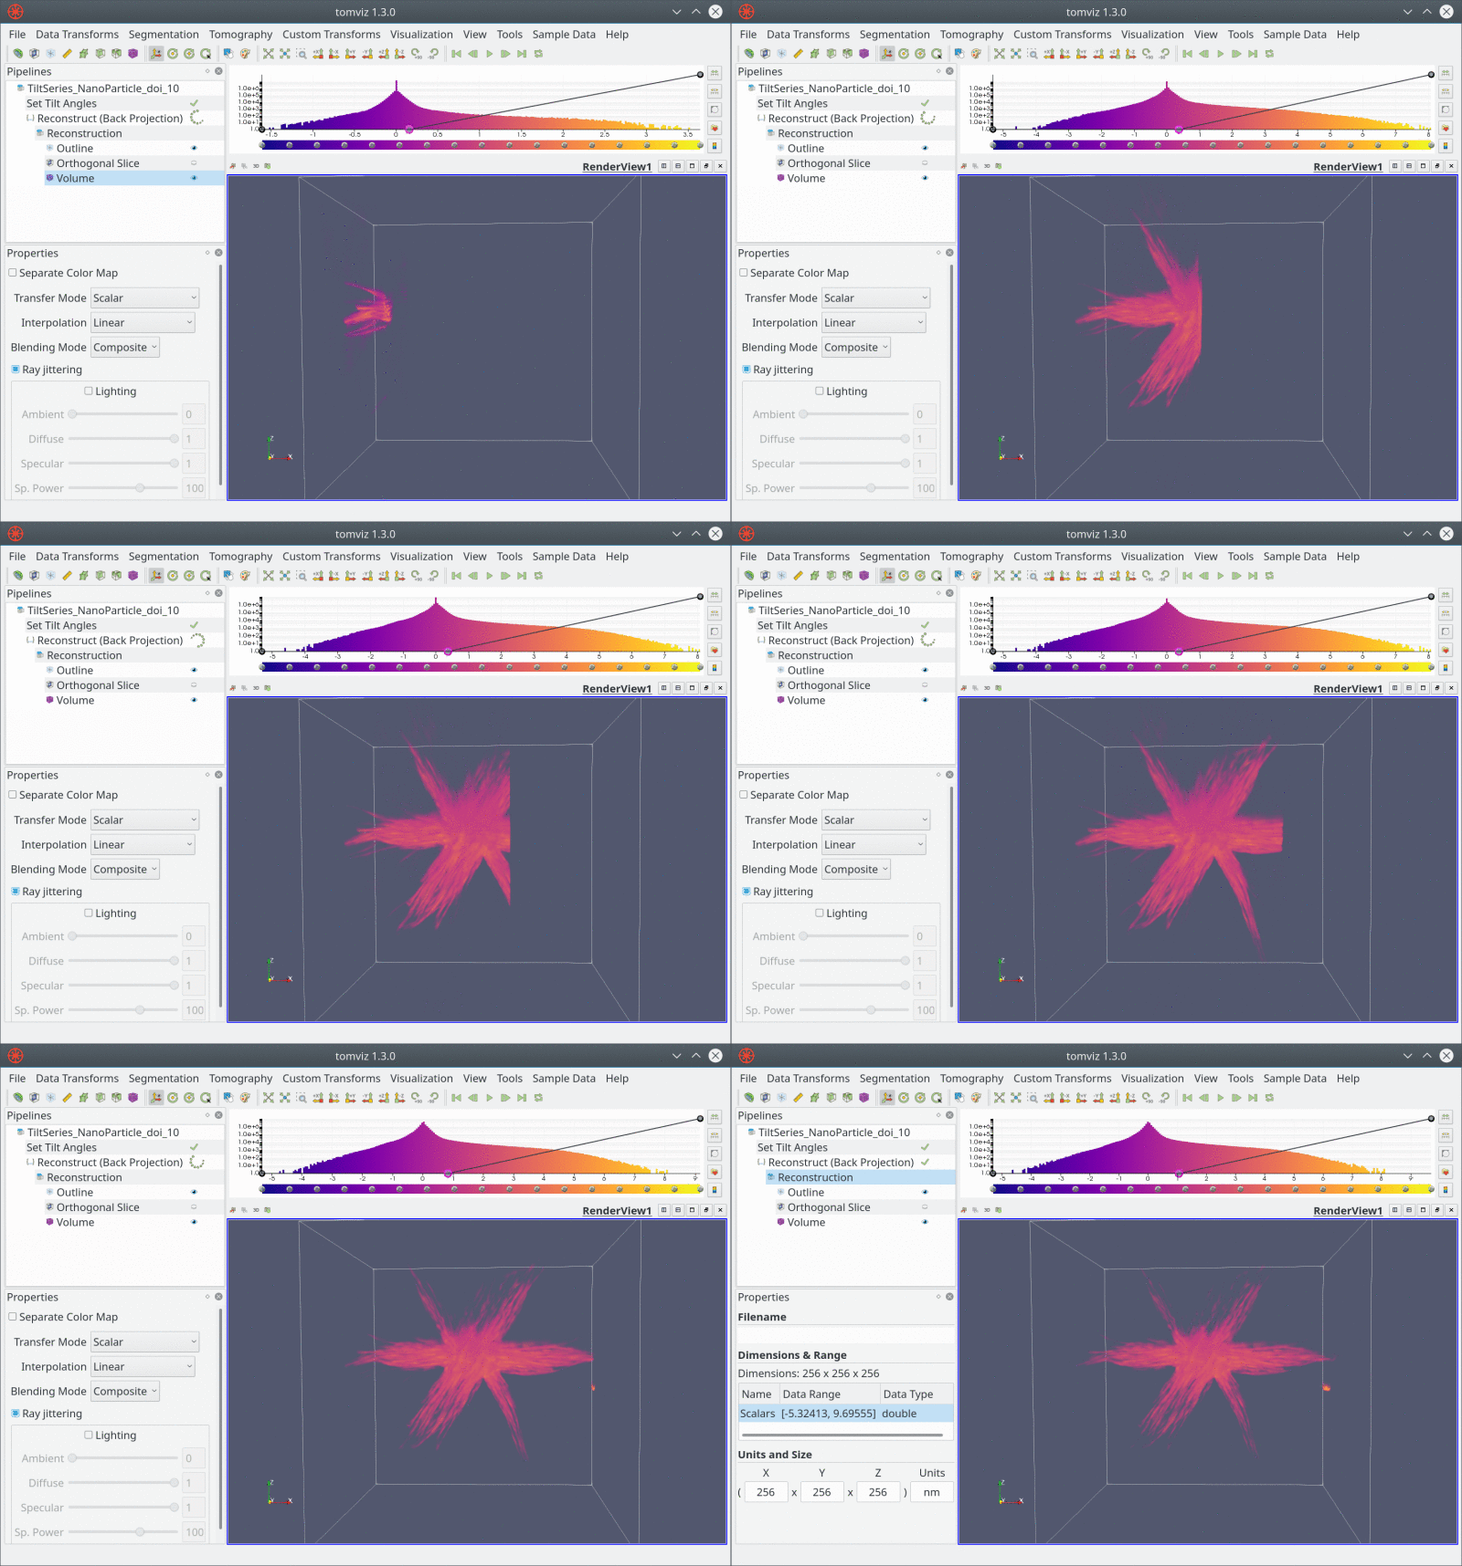
We are pleased to announce the release of Tomviz 1.3 (GitHub release page). This release features some big changes to our pipeline, state file, and related functionality. The pipeline now explicitly shows the input and output data, with the visualization modules attached to the data that is being visualized. These changes have been carried through to the state file, which is now represented using JSON reflecting the hierarchy shown in the application. The pipeline now supports live updates (experimentally) for both reconstructions and data acquisition. The user interface saw a number of updates to improve the default layouts, and make the best use of space. A number of enhancements have focused on improving load times of the application at startup, and when executing the Python environment. Tilt angles can be loaded from a file now, and custom Python operators can be easily added from a menu item. Support for images with multiple components has been added, and separate images can be merged.
Usability has been improved, with manual alignment operations supporting reopening of the dialog to further edit, and a view code button added to Python operators. Image stack loading has seen improvements, basic consistency of image sizes is verified and errors displayed. There are a huge number of bug fixes and improvements that were developed by our team.
The Tomviz project is developed as part of a collaboration between Kitware and the University of Michigan under DOE Office of Science contract DE-SC0011385. This is a community project, and we are very pleased to take input and contributions from all in the community.