Scalable Visual System for Nonproliferation Analysis

Our first step was to acquire the data from various sources and fuse them to build a proliferation database. We acquired hundreds of documents from the NIS Nuclear Trafficking Database (NTI). To collect these documents, we wrote a minimal website crawler using Python (pycurl and SGMLParser).
For a more substantial dataset, we collaborated with Juliana Friere (Professor, University of Utah). She and her colleagues used NTI as the seed documents to identify similar articles on the web using sophisticated web crawling techniques. We were able to extract relevant information from HTML using a custom algorithm developed on top of the open source tool BeautifulSoup.

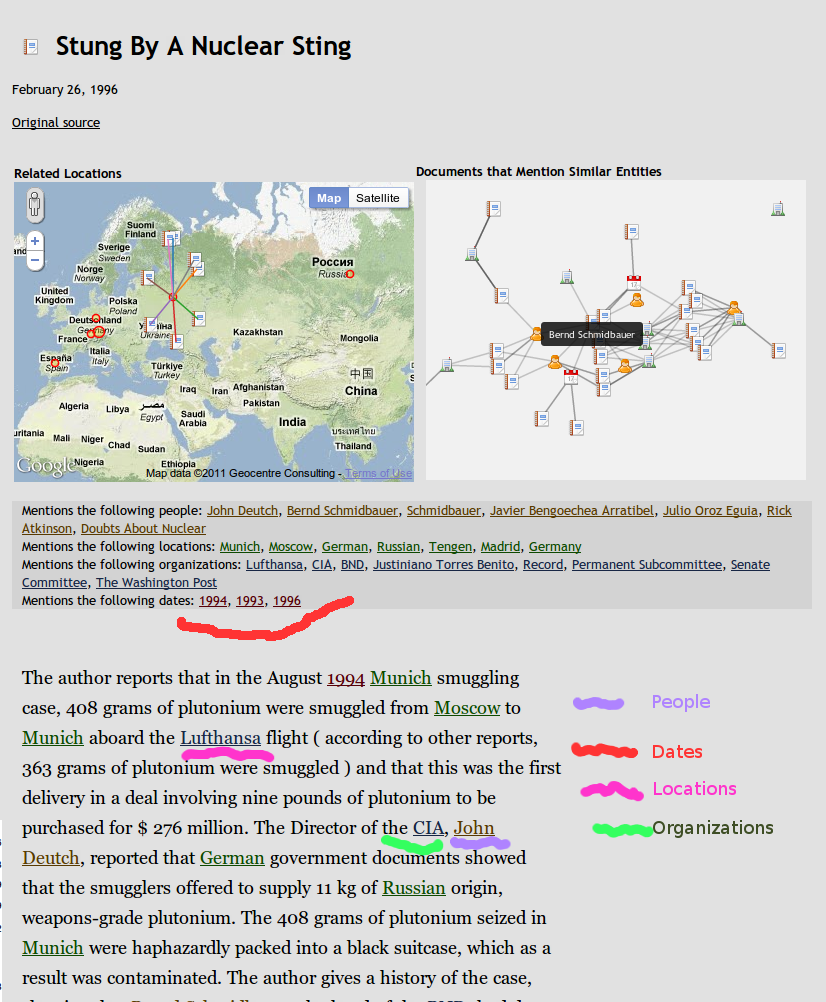
Our raw data from the database was processed so as to acquire information pertaining to time and location of the event, people and organizations involved. To accomplish this, we explored the open-source Stanford Named Entity Recognition (SNER) toolkit and Natural Language Toolkit (NLTK).

We also investigated another method for extracting interesting information from our datasets called topic modeling. Topic modeling produces two kinds of result sets: words associated with topics and documents related to topics. We used these results to summarize the content of the documents and to produce links between related documents and topics.

In order to test scalability of the system, we ingested 560,000 abstracts from PubMed into the database with associated metadata in about 20 minutes, and named entity extraction in about 2 seconds per document.

Once we gathered all the relevant metadata, we developed an online system where users could issue a query and visualize the result of the query. This online system was primarily built on top of Midas using Postgres for the database backend, and Protovis and Google Maps API V3 for visualization.

Authors: Jeff Baumes, Aashish Chaudhary
Outstanding writeup, outstanding work!