Orchestrating Medical Imaging Workflows: A Dagster-Based Approach for Population Studies in Osteoarthritis
In the ever-evolving field of medical imaging research, managing complex datasets and ensuring smooth data workflows is often challenging. The processing steps involved, such as image normalization, segmentation, registration, and statistical analysis, must be carefully orchestrated to ensure both accuracy and reproducibility. As part of our collaborative research project with the University of North Carolina at Chapel Hill on osteoarthritis, we’ve turned to Dagster–a powerful open source data orchestration tool, to manage our data pipelines.
The Osteoarthritis Initiative (OAI) is a comprehensive ten-year study funded by the National Institutes of Health (NIH) aimed at understanding knee osteoarthritis, one of the leading causes of disability in adults. In our work, we developed an open source analysis pipeline, to produce 2D cartilage thickness images from the OAI dataset, which contains magnetic resonance image (MRI) data of the knee. The execution and processing of the massive population study of 48,067 MRI volumes is orchestrated by Dagster using a modified version of the Knee-SARG pipeline.
Workflow management and data orchestration are critical in today’s data-driven world because they allow teams to efficiently automate and track complex processes. At its core, an orchestrator automates the execution of a set of steps and helps you monitor and understand each step’s performance. This automation helps keep data assets, like reports or models, accurate and up-to-date, while also providing visibility into performance and potential issues. With a data orchestrator, teams can easily spot where things break, understand why, and ensure reliable, high-quality data operations without the manual effort.
Why Dagster?
Dagster is a Python framework designed to help build, execute, and monitor workflows that involve complex data processes. Unlike traditional orchestration tools, Dagster focuses on the data assets themselves rather than merely executing tasks in sequence. It enables defining, scheduling, and executing workflows while ensuring that tasks in a pipeline can be easily reused, tested, and debugged locally, with an emphasis on reliability, scalability, and developer productivity.
In Dagster, data assets are treated as first-class citizens. It offers strong abstractions for end-to-end lineage of data and its dependencies, improving data observability, and integrates with various plugins, cloud services and data warehouses. Pipelines in Dagster are defined as direct acyclic graphs (DAGs) in a declarative fashion. The units of execution, called “jobs”, can be defined in Python with a clear structure. Each computation step in the pipeline, called an “asset”, is a reusable component and can be defined as a function.
Dagster also provides a web-based GUI for monitoring, logging, rerunning, and scheduling with detailed visualization for pipeline DAG and execution statuses.
Dagster for Image Processing in Knee-SARG
Dagster offers a host of features that make it useful for medical imaging studies. For the osteoarthritis project, we used Dagster to orchestrate an entire pipeline for medical imaging data analysis.
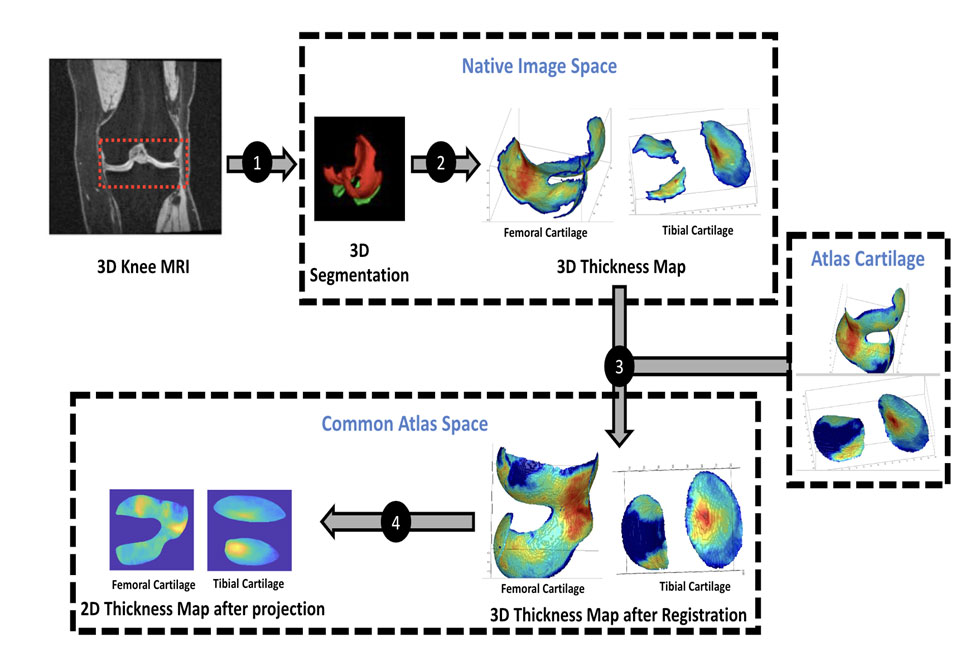
The pipeline starts with the ingestion of patient knee MRI scans. After ingestion, the data undergoes several preprocessing steps, including image reading and reorienting, intensity normalization, and cartilage segmentation using deep learning. It then registers patient images to an atlas for alignment, followed by transforming patient meshes of femoral and tibial cartilage into the atlas space, bisecting them into inner and outer surfaces, and calculating cartilage thickness based on the distance between the surfaces. The pipeline concludes by projecting the atlas mesh to 2D for further analysis. Each of these steps produces intermediate results, allowing for flexibility, easy debugging, and (in the future) reusability.
Screenshots of patient 9016304, 96-month-follow-up, left knee. This case has both pathology and some common image analysis artifacts (imperfect segmentation, including spurious islands):
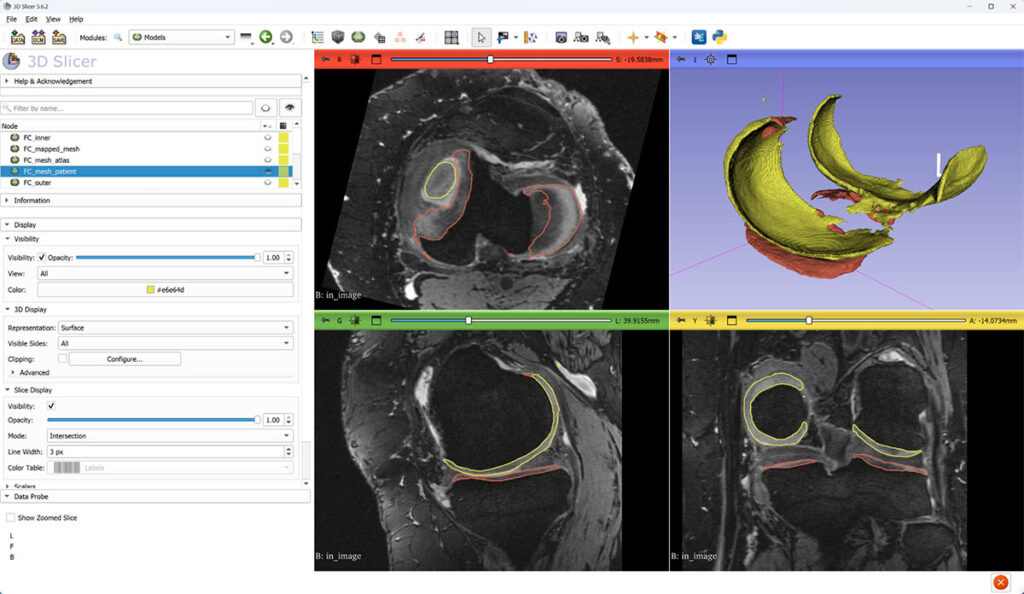
Grayscale: magnetic resonance image. Yellow: femoral cartilage (FC) surface. Red: tibial cartilage (TC) surface.
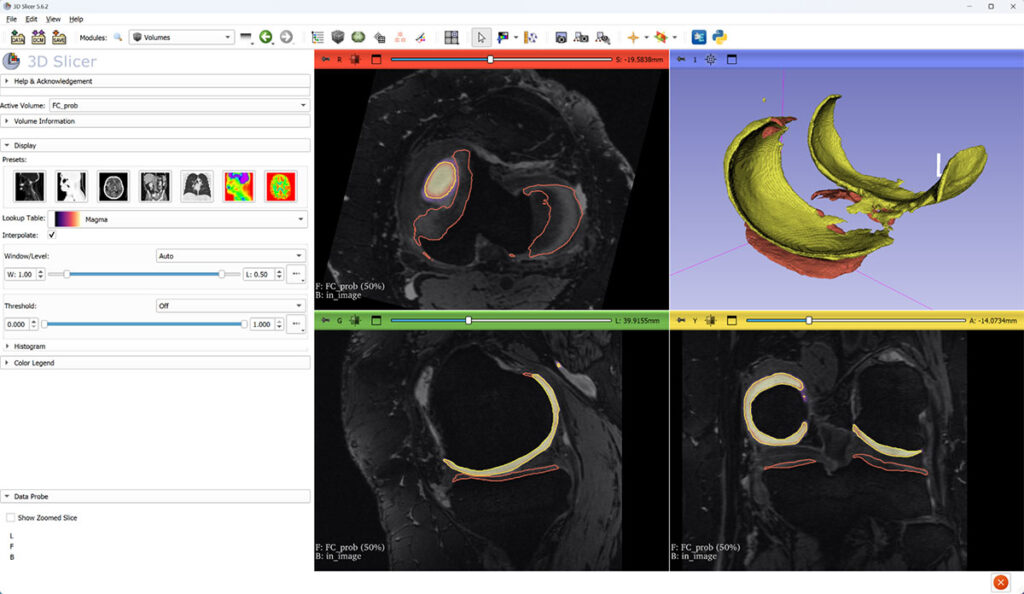
Femoral cartilage probability overlaid on top of MRI. FC and TC surfaces are constructed at 50% threshold of probability image.
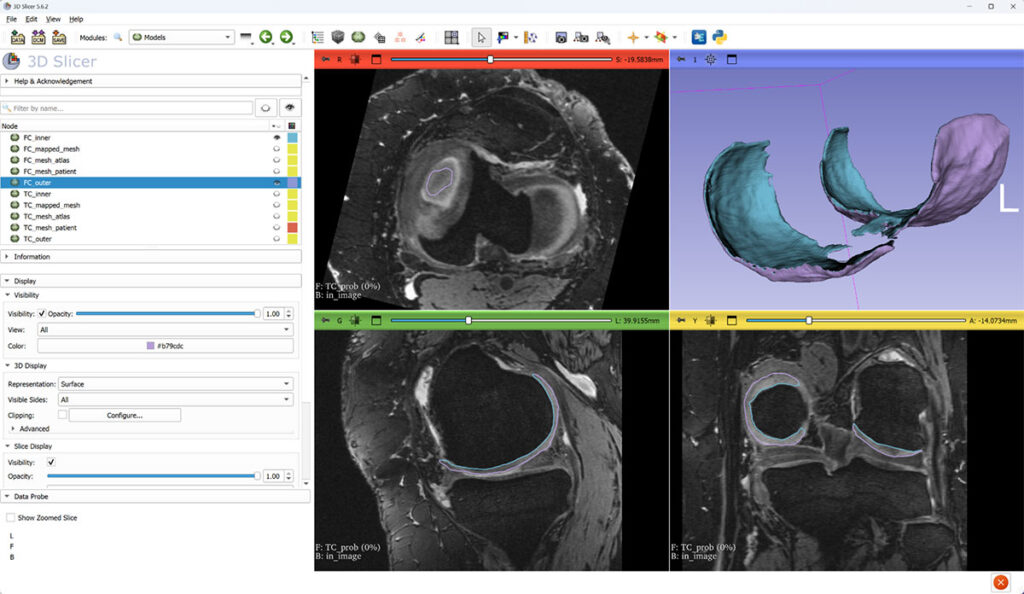
After island filtering, cartilage meshes are split into inner (blue) and outer (purple) parts, and their mutual distance is interpreted as cartilage thickness.
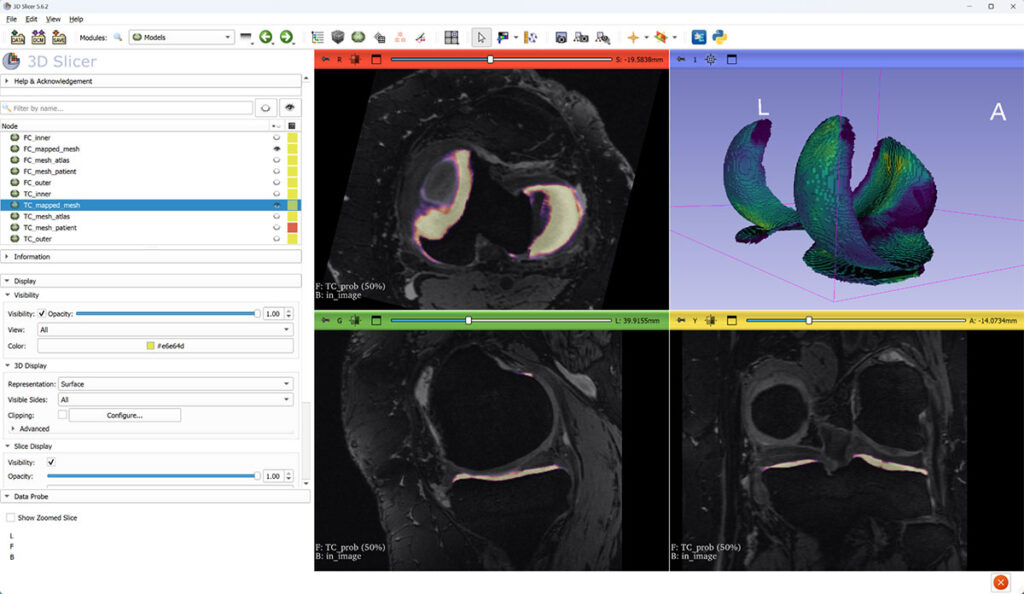
Thickness is computed for each vertex of the “outer” surface part and then mapped to a canonical atlas mesh (3D view). Slice views show tibial cartilage probability on top of MRI.
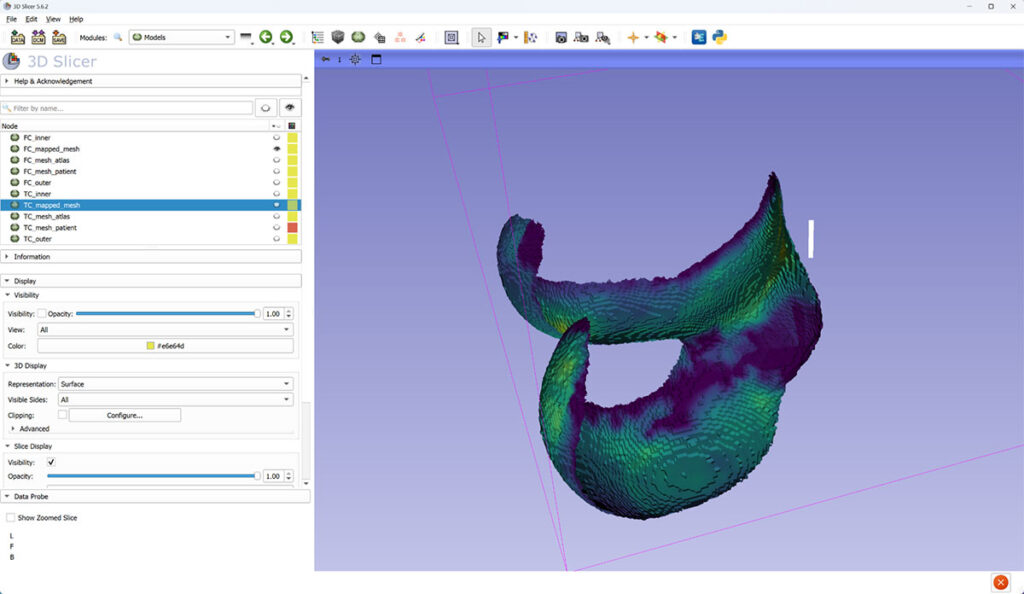
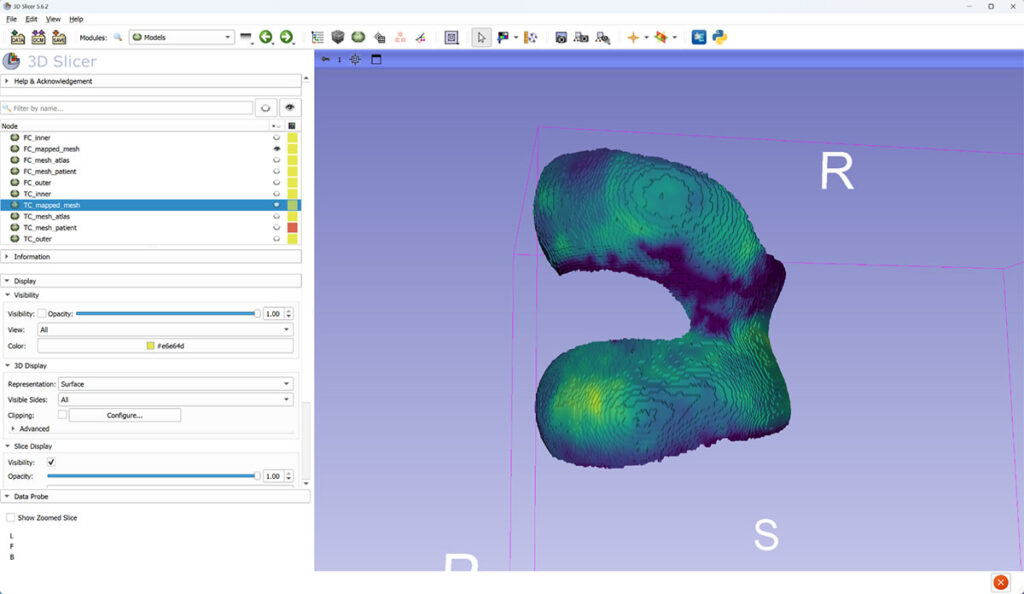
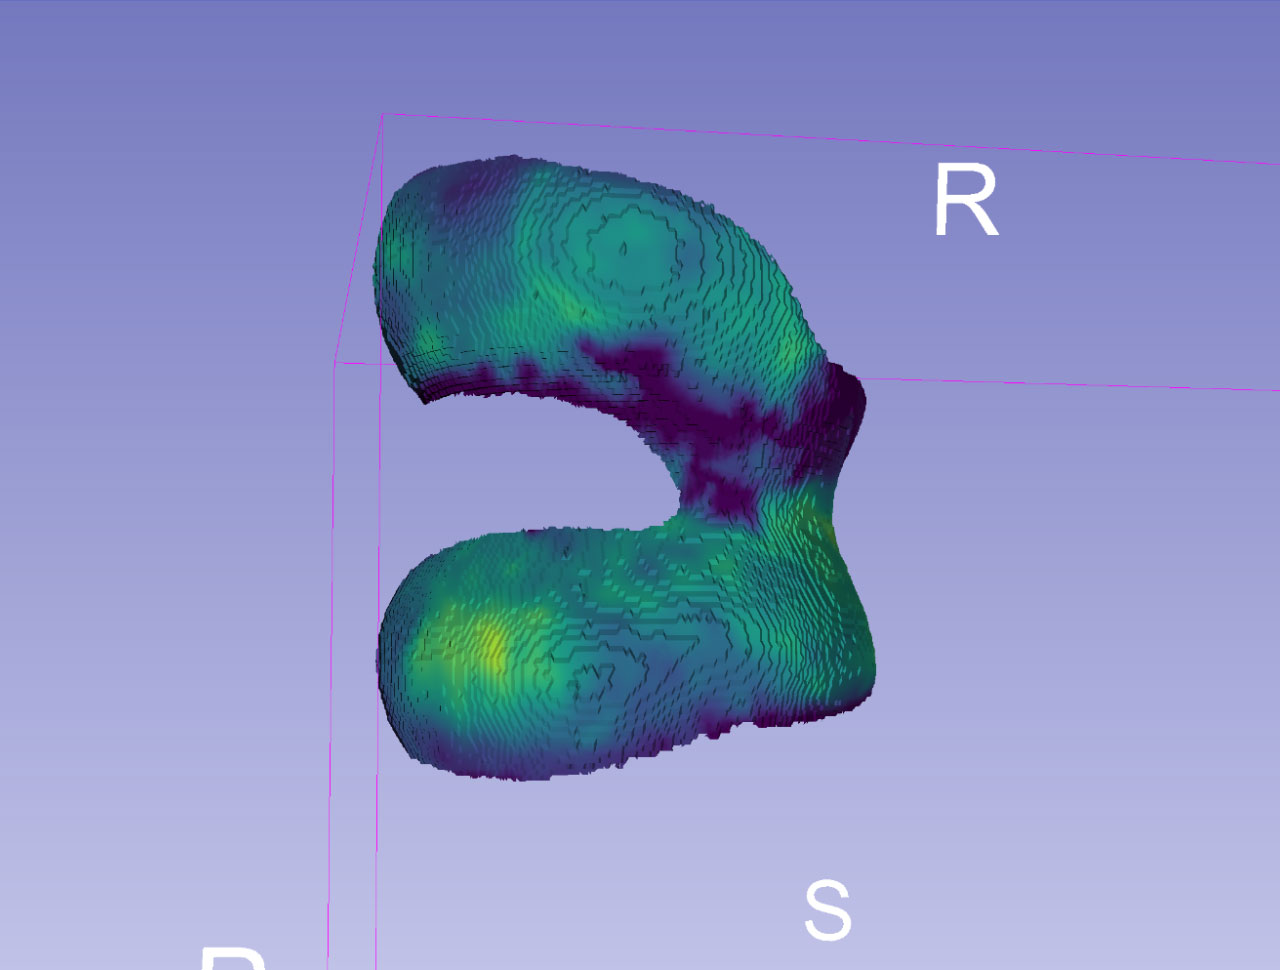
Two different 3D views of femoral cartilage (FC) thickness mapped to canonical mesh.
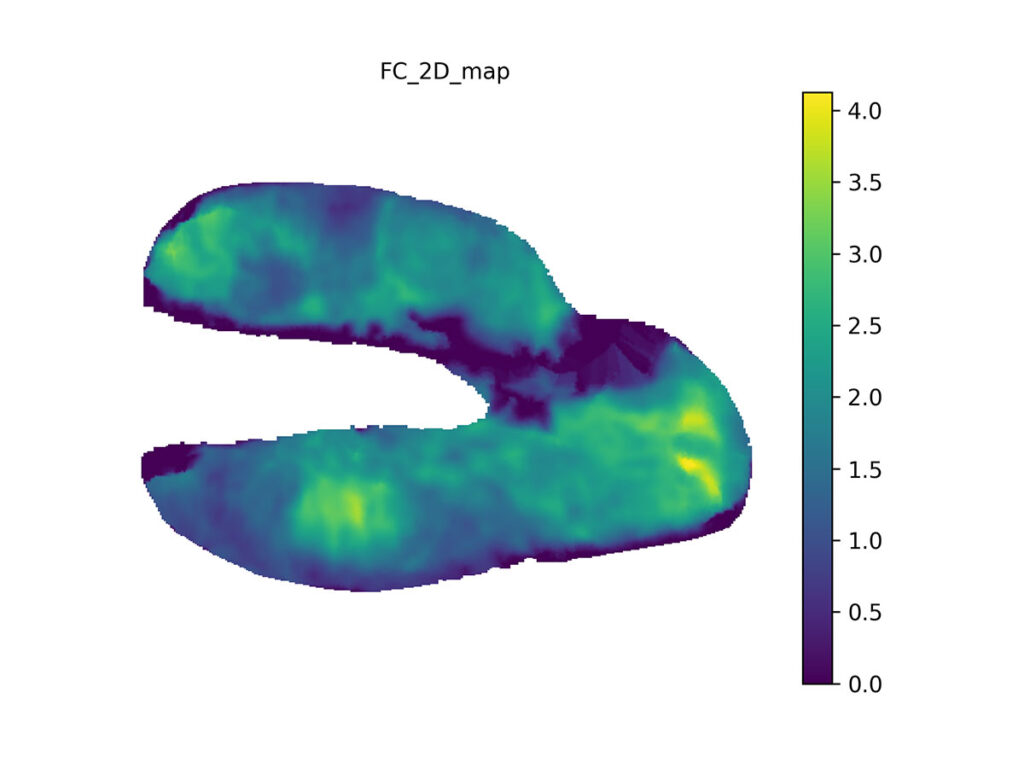
We use pre-computed mapping from canonical mesh to 2D to make analysis and comparisons easier. Cartilage thicknesses are measured in millimeters (scale bar), with the thickest part here being slightly over 4 mm thick.
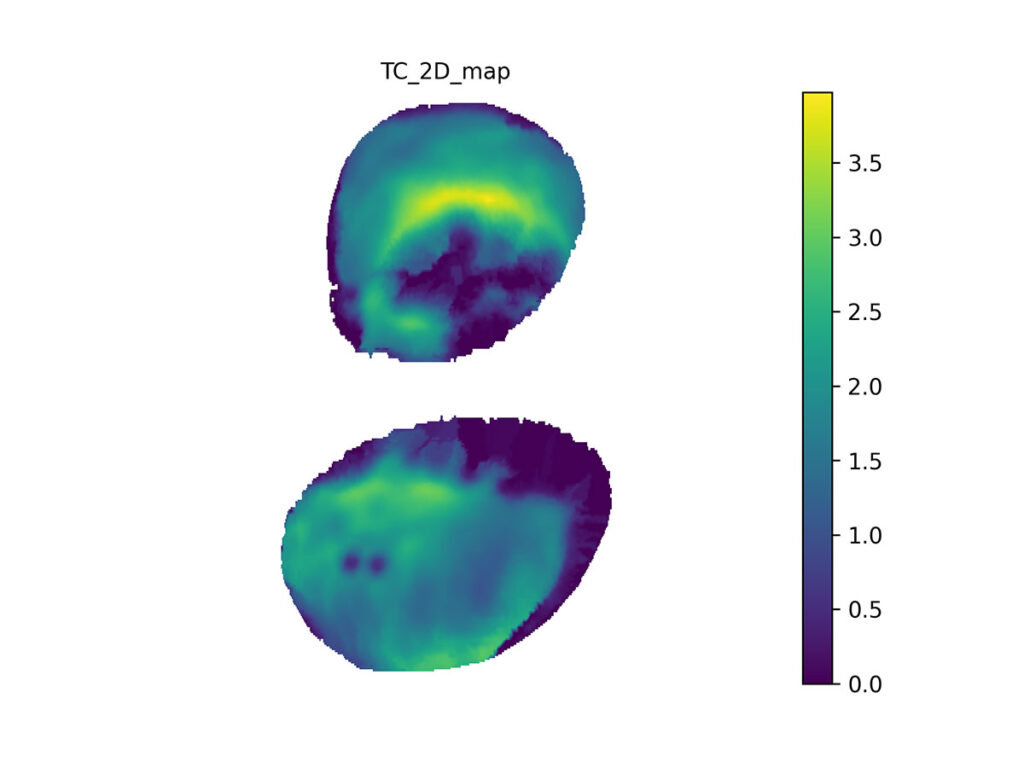
We also map the tibial cartilage from canonical mesh to 2D. Here, the thickest part is about 3.5 mm thick.
By leveraging Dagster, we can parallelize data ingestion and preprocessing tasks, handling large volumes of imaging data seamlessly. Its ability to track the lineage of each data transformation ensures full reproducibility, a crucial aspect in medical research. Dagster could help automating our exploratory statistical analyses by running a Jupyter Notebook as part of the job.
With Dagster’s observability features, we can monitor each step of the pipeline, catch errors early, and ensure the reliability of our results. It provides excellent error handling–when an error occurs, the GUI surfaces the reason for the failure with context, such as the step in the job that failed along with a specific data involved. Additionally, Dagster’s “Resources” feature makes it easy to abstract implementations of key points in the pipeline. With a runtime configurable resource, we can run our image processing pipeline on the same computer running Dagster, via SSH, or on a SLURM cluster, without needing to alter the steps in our job.
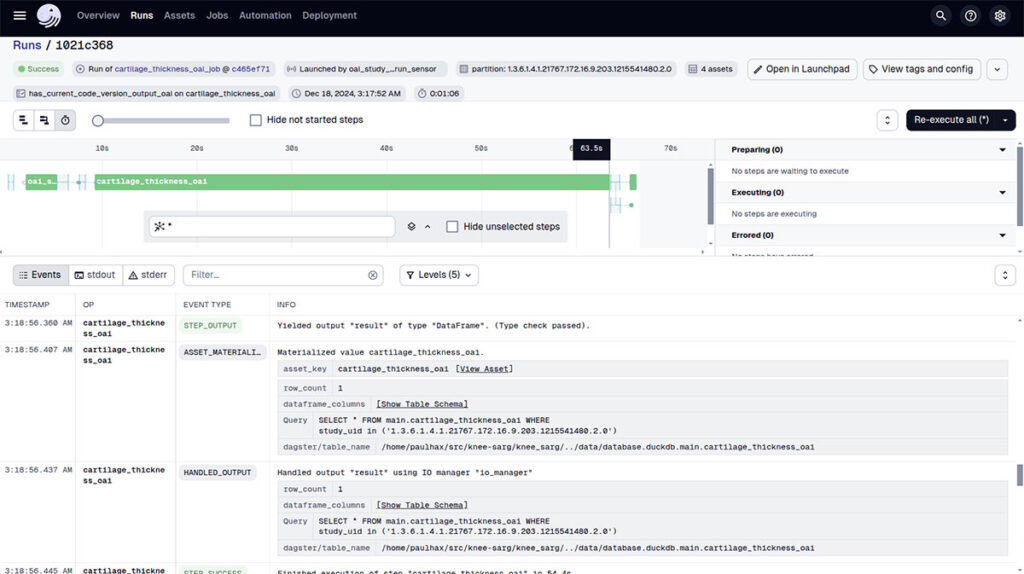
Dagster allows for easy comparison of image analysis outputs across code versions by tagging job runs with a “code version.” This ensures that output image files are archived alongside the specific version of the analysis code used to generate them.
Adapting the Knee-SARG Dagster pipeline to datasets beyond OAI is straightforward. The pipeline begins with a normalization step that converts DICOM MRI images to NRRD format and extracts metadata into JSON files. For new data sources, a step is needed to write files in the designated format to a specific directory. Additionally, a Python logic is required to transform the dataset into the chosen format. Dagster can then monitor this directory for new files and automatically process them.
While Dagster has been a powerful tool for managing this workflow, we encountered some challenges that impacted our experience.
- Tabular Data Focused: The Dagster programming model is optimized for tabular data models. The most natural way to implement a step in a pipeline is to completly recreate a table. To push individual images through the pipeline steps, Dagster has a “partition” feature. However, partitions introduce limitations on how steps in the pipeline are linked and the GUI makes it hard to run the pipeline with specific partitions seleced.
- Platform Lock-In: It is easy to integrate image processing code into Dagster’s decorated functions or pass its “resources” into domain-specific logic, which can lead to platform lock-in, making it harder to adapt or migrate workflows later.
- Job Execution Model: Dagster’s sequential job model doesn’t easily support batching. We wanted to process multiple images in parallel, for example, running them through segmentation and then registration, but this wasn’t straightforward to implement.
Finally, it is worth mentioning that Dagster is not the only option available for managing medical imaging workflows. Tools like Apache Airflow, Perfect and Luigi are also popular in the data engineering space. For simpler projects, vanilla Python paired with a Celery task queue could also be a good alternative.
Summary
Using Dagster for population study in our project provided significant advantages in managing large, complex medical imaging workflows. The tool’s modularity, scalability, and strong observability features helped automate the pipeline ensuring reproducibility and ease of debugging. However, challenges like limited support for batch processing, platform lock-in, and Dagster’s tabular data focus were key considerations that may impact its suitability for other medical imaging projects.
Acknowledgments
This project was supported by the National Institutes of Health (grant 1R01AR082684-01). Special thanks to the team that is managing the Github Organization open-radiogenomics and the Knee-Sarg platform developers for their contributions to the osteoarthritis analysis pipeline, especially to Matt McCormick, who introduced and launched this effort in our project.
Want to learn more? Kitware can help.
At Kitware, we specialize in delivering tailored solutions for medical imaging data workflows and integrate machine learning tools. With deep expertise in data orchestration and medical computing, we can support you in building scalable, reproducible pipelines like those used in the osteoarthritis study. Contact us today to discuss how we can help streamline your project and ensure long-term success.