Microscopy & Microanalysis
July 28 – August 1, 2024 in Cleveland, Ohio
Microscopy and Microanalysis (M&M) is the premier microscopy education and networking event that brings together researchers, academics, and engineers. Kitware is excited to be exhibiting this year to showcase three of our open source applications – Tomviz, trame, and MultivariateView. Kitware can partner with you to research new visualization and analysis techniques and customize these tools to meet your needs. To learn more, contact our team or visit us at Booth 335.
Vendor Tutorials
trame: An Open Source Framework for Efficiently Building Interactive Visualization and Analysis Applications
Monday July 29 and Wednesday July 31, 2024
5:45 PM – 6:45 PM
Booth 335
In this hands-on demonstration, learn how to utilize trame for quickly building applications to accelerate your research and expedite your workflows through interactive visual analysis and exploration.
Tomviz: Leverage Your 3D Tomographic Data
Tuesday July 30, 2024
5:45 PM – 6:45 PM
Booth 335
In this hands-on demonstration, learn how to utilize Tomviz as a complete analysis pipeline for 3D tomographic data including alignment, reconstruction, segmentation, and interactive 3D visualization.
Multivariate Volume Visualization Presentation
Multivariate Volume Data: Achieving Deeper Insight through Multivariate Volume Rendering and Machine-Guided Exploration
Presenter: Patrick Avery, Ph.D. Staff R&D Engineer
Wednesday July 31, 2024
11:30 AM – 11:45 AM
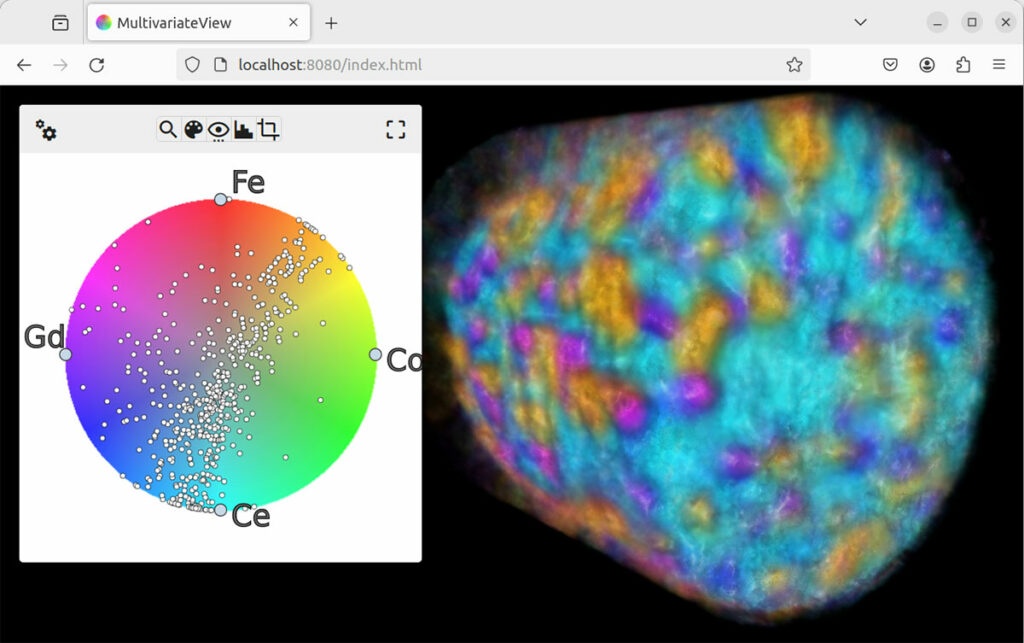
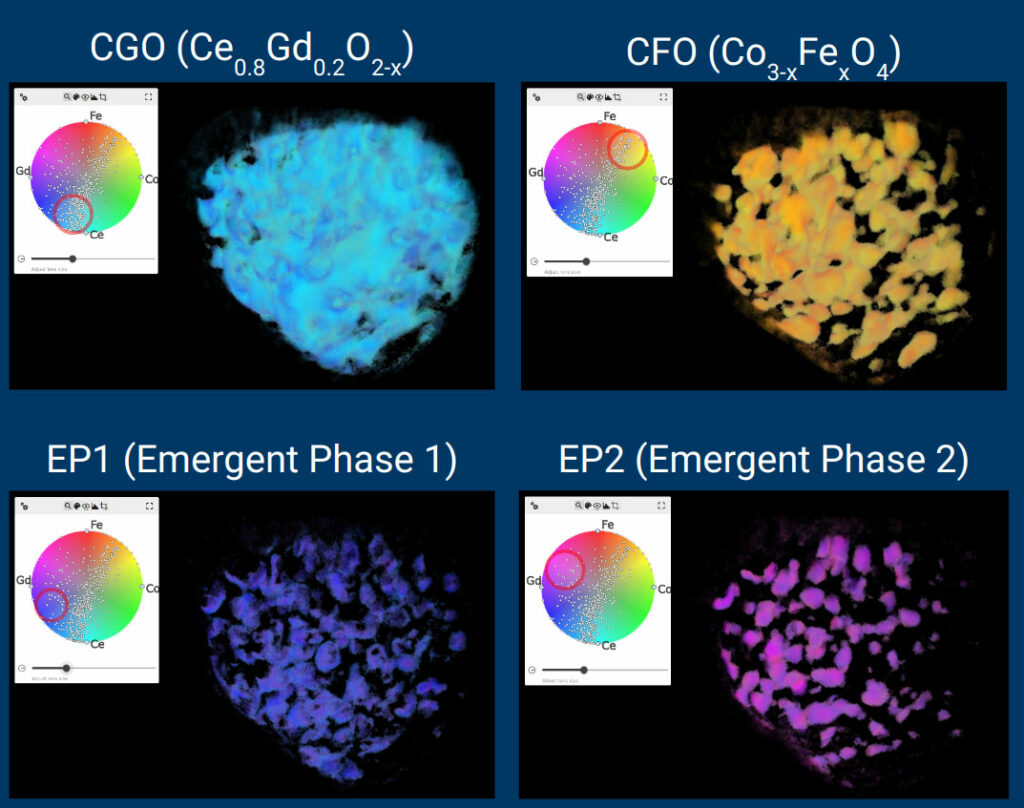
Detailed analysis of nanoscale imaging data plays an important role in guidance for future experiments and successful scientific discoveries. However, increasing complexity and production of nanoscale imaging data have made this analysis more difficult, and, in some situations, infeasible. Multivariate volumetric data, which contains more than one channel per voxel, has become increasingly prevalent in important industries such as battery technology. Due to its multidimensional nature, however, multivariate data is complex and usually requires substantial human effort to analyze. Oftentimes, each channel is visualized separately and individually. However, this does not reveal the complex yet frequently important interactions between the channels.
The open source prototype MultivariateView is actively being developed to solve many of these challenges. Funded by a DOE Phase I SBIR, and based upon the RadVolViz application, we are actively building prototypes and exploring new techniques to visualize and analyze many channels in volumetric data simultaneously.
In our presentation, we will demonstrate the current status of our research efforts, along with our ideas and plans for the near future.
trame Presentation
trame: an Open Source Framework for Efficiently Building Interactive Visualization and Analysis Applications
Presenter: Patrick Avery, Ph.D. Staff R&D Engineer
Wednesday July 31, 2024
2:45 PM – 3:00 PM
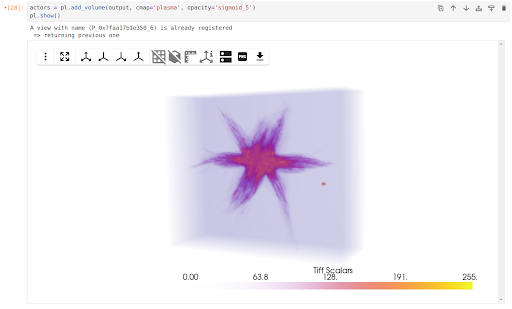
Designed to integrate seamlessly with the industry-leading open source visualization platforms VTK and ParaView, trame compactly and intuitively enables complete control of 2D and 3D data processing and visualization pipelines. From exploring new visualization and analysis techniques, to optimizing AI training and inference, trame has the potential to accelerate your research and help you exceed your goals.
Designing web applications traditionally requires knowledge of several programming languages, such as JavaScript for the client and Python for the server. trame, however, simplifies development so that web applications may be written completely in Python, one of the most concise and widely-known programming languages. The entire UI layout, including 2D and 3D render windows and widgets such as buttons, sliders, drop-down menus, etc. can be defined in pure Python. The use of Python also provides access to the wide variety of state-of-the-art open source scientific and mathematical packages available to the Python community. trame’s write-once, run-anywhere paradigm also provides great flexibility for deployment, from desktop to cloud, Jupyter and HPC.
In our presentation, we will show you how our open source framework can efficiently build visually stunning, interactive web applications for scientific visualization and analysis.
Tomviz Poster Presentation
Combining Interactive and Automatic Volume Registration Techniques in Tomviz
Presenter: Patrick Avery, Ph.D. Staff R&D Engineer
Wednesday July 31, 2024
3:00 PM – 5:00 PM
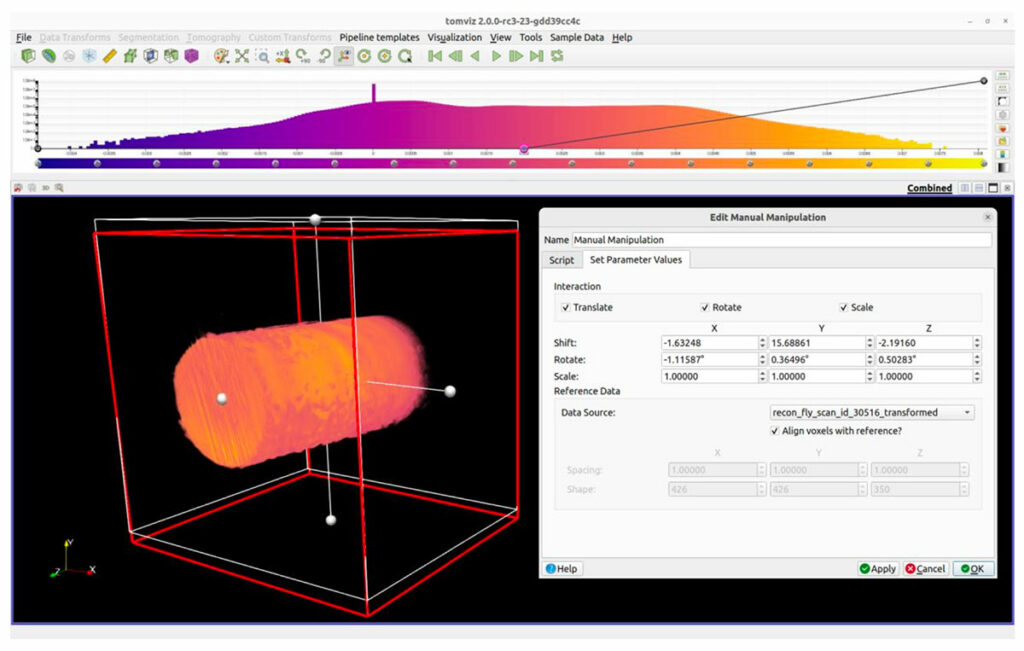
Tomviz is a cross-platform, open source tool for the visualization and analysis of tomography data. Built on top of the industry-leading open source visualization platforms ParaView and VTK, Tomviz provides state-of-the-art rendering techniques and a broad collection of tools for image processing such as tilt image alignment, tomographic reconstruction, histograms, filters, user-customized Python scripts, and many researcher-contributed algorithms.
In this poster presentation, we will discuss a new “Manual Manipulation” operator that facilitates manual registration through familiar visualization scene interactions. When the user aligns the volume to another volume through ordinary camera interactions, this operator tracks these interactions in order to populate registration parameters (including shift, rotate, and scale), which are then performed on the underlying data.
We will also discuss a new Elastix-based “Registration” operator that may be performed to automatically align two volumes, often immediately after manual alignment has been performed.