Introducing Web-OTM (Optimal Transport Morphometry): A Web-Based Application for Advanced Neuroimaging Population Analysis
Understanding the structural differences in neuroimaging datasets is key to discovering insights into brain-related diseases and conditions. Traditional approaches like voxel-based morphometry (VBM) have paved the way for quantitative brain analysis, but new methodologies can uncover even more profound insights. One such method is Unbalanced Optimal-Transport Based Morphometry (OTM), which detects regional and global changes in matter separately from changes in the location of matter—discovering effects that traditional VBM analysis might miss.
What is OTM
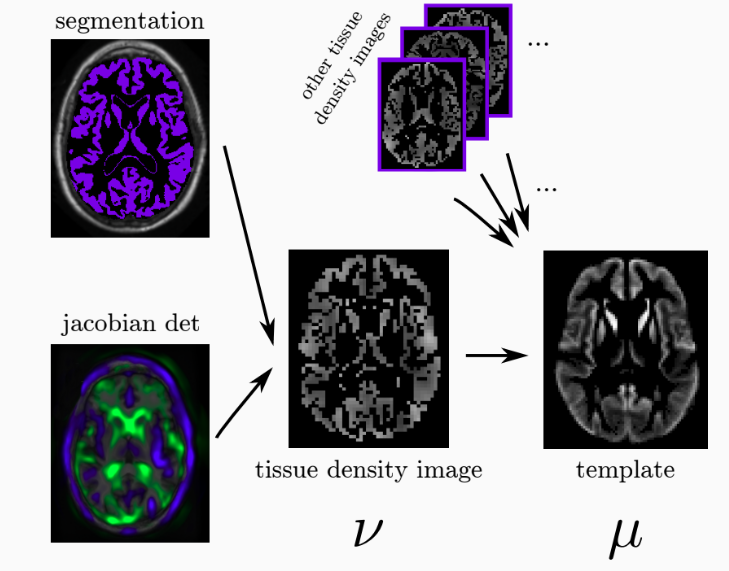
OTM is a novel methodology for population analysis of neuroimaging datasets, designed to address the limitations of traditional voxel-based morphometric analysis. Unlike VBM, which analyzes structural changes by comparing the concentration of brain matter across different regions, OTM can disentangle and separately measure changes in the amount of matter from changes in its location. This distinction allows OTM to detect more subtle and complex effects in neuroimaging data. The methodology and experimental results behind OTM were recently published in a scientific paper available on PubMed here.
Bringing OTM to the Web
To make this advanced analysis accessible to researchers and clinicians, we’ve developed a web-based application that leverages OTM for neuroimaging population studies. Our application is designed to provide a user-friendly interface for conducting complex analyses, visualizing the results, and understanding the nuances of neuroimaging datasets.
Powered by VTK.js for Advanced Visualization
At the core of our web application is the Visualization Toolkit for JavaScript (VTK.js), a powerful library that brings the advanced data analysis and visualization capabilities of the popular VTK C++ library to the web. VTK.js uses WebGL to deliver fast, robust, and interactive visualization experiences, bridging the gap between web-based visualization and VTK’s sophisticated data structures.
The system is capable of supporting advanced visualization techniques allowing users to explore their neuroimaging data in detail directly from their web browser.
Key Features of the Web Application
The OTM web application is designed with a focus on usability, allowing researchers to perform complex analyses with ease. The interface is divided into four main components:
- Data Upload and Preprocessing Specification: Users can upload their neuroimaging datasets and define preprocessing steps necessary for the analysis.
- Preprocessing Quality Control: After preprocessing, users can inspect and verify the quality of the preprocessed data to ensure accuracy before moving on to the analysis phase.
- Clinical Variable Upload and Analysis Specification: Users can upload clinical or demographic variables associated with their imaging datasets and define the specific analyses they want to conduct using OTM.
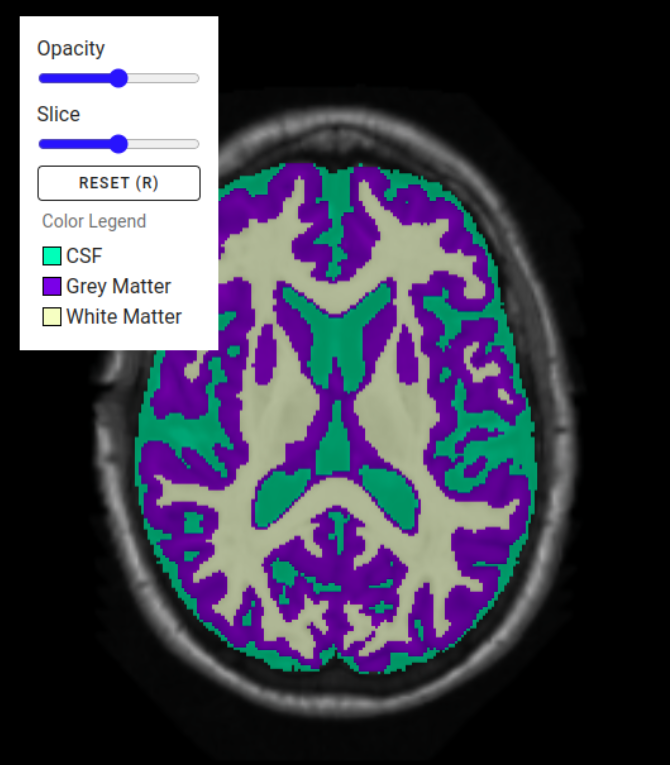
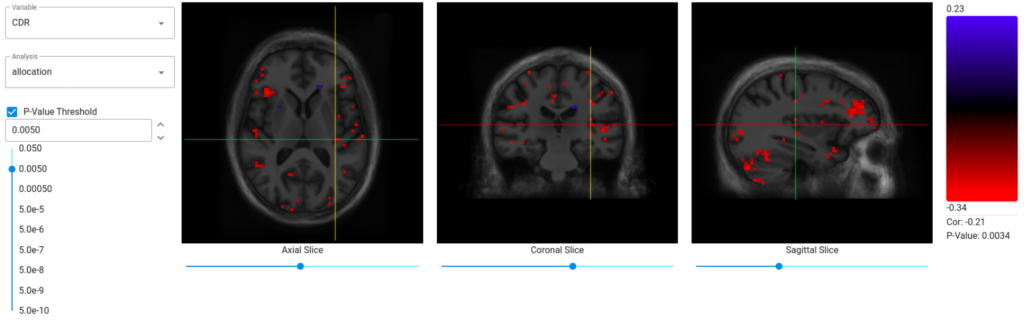
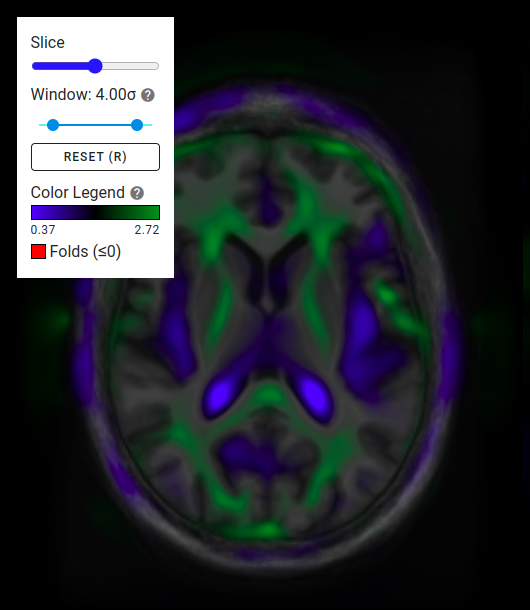
- Result Visualization: The application provides advanced visualization capabilities powered by VTK.js, allowing users to explore and interpret their analysis results directly in the browser. Volume rendering and other advanced techniques are available to help visualize complex neuroimaging data effectively.
The application was built using modern web and cloud technology for a scalable deployment.
See the Application in Action
We have created a video demonstration showcasing the features and capabilities of our OTM web application.
Schedule a Live Demo
If you’re interested in learning more or trying it out for your research, we invite you to watch the demo and sign up for access. Our team is also available to discuss how this methodology can be applied to your use case.
Sign up for a demo and discussion here.
Acknowledgment
Research reported in this publication was supported by the National Institute Of Mental Health of the National Institutes of Health under Award Number R42MH118845. The content is solely the responsibility of the authors and does not necessarily represent the official views of the National Institutes of Health. The percentage and dollar amount of the total program or project costs are financed with federal money, and the percentage and dollar amount of the total costs are financed by nongovernmental sources.
Percentage: 100%, Nongovernment: 0% N/A, and Ceiling Total: $1,608,054