Introducing SlicerAstro: A Visualization Tool for Hydrogen in Galaxies
![]() Upcoming neutral hydrogen (HI) surveys will deliver large data sets, in which daily dataflow will reach one terabyte. One of these surveys, Apertif [1], will provide information about HI in and around hundreds of thousands of galaxies. To find and characterize HI objects, automated processing methods must use all of the three-dimensional (3D) information (two positional dimensions and one spectral dimension) that the surveys make available. Three-dimensional visualization is essential to the qualitative and quantitative human inspection of results from automated source-finding and analysis pipelines [2].
Upcoming neutral hydrogen (HI) surveys will deliver large data sets, in which daily dataflow will reach one terabyte. One of these surveys, Apertif [1], will provide information about HI in and around hundreds of thousands of galaxies. To find and characterize HI objects, automated processing methods must use all of the three-dimensional (3D) information (two positional dimensions and one spectral dimension) that the surveys make available. Three-dimensional visualization is essential to the qualitative and quantitative human inspection of results from automated source-finding and analysis pipelines [2].
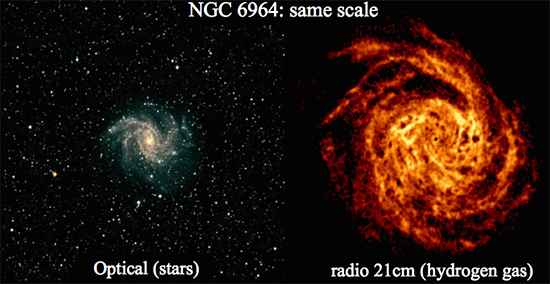
SlicerAstro [3,4] is an extension of 3D Slicer [5] that aims to provide astronomers with a powerful and interactive visualization environment. In this environment, astronomers can analyze complex sources that automated pipelines such as SoFiA [6] find. These sources include interacting galaxies, tidal tails, HI filaments, and stripped galaxies.
An exhaustive review of open-source 3D visualization packages [2] led to the choice of 3D Slicer as the preferred platform for the development of SlicerAstro. The factors behind this choice include the following:
- 3D Slicer is an open-source platform with a Berkeley Software Distribution (BSD) license, which allows for free utilization of the software.
- The software has a flexible environment for code development and collaboration.
- 3D Slicer has adequate documentation for both developers and users.
- The 3D Slicer software has a number of active developers.
- The 3D Slicer interface already implements numerous quantitative features.
In addition, the medical visualization tools that 3D Slicer implements suit the needs of astronomical applications. For example, 3D Slicer optimizes the display layout and the process of navigating through data for parallel two-dimensional visualizations (e.g., movies of channel maps).
Three-dimensional Inspection of HI in Galaxies
The following example uses an observation of the WEIN069 galaxy in the Perseus-Pisces supercluster filament. The example shows in detail the character of a radio emission of HI in and around the galaxy. The example also illustrates the benefits of 3D data visualization.
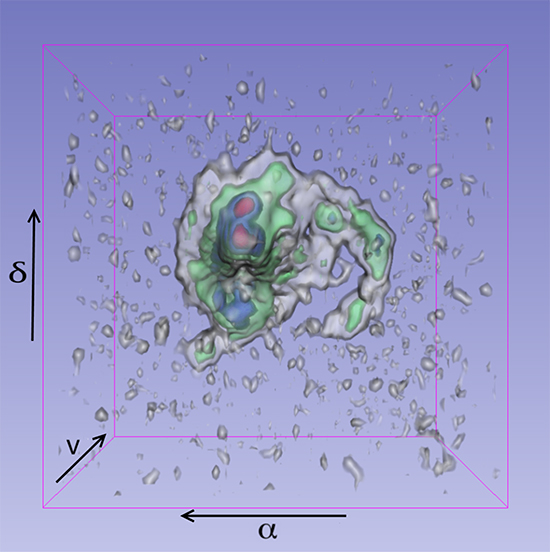
In the following video, a 3D view displays the HI distribution and the kinematics of WEIN069. The view provides an immediate summary of the structures in the data that pertain to space and velocity. The view confirms that the structures are coherent in all three dimensions. Two spatial dimensions (right ascension, α, and declination, δ) measure the projection of HI onto the sky. The radial velocity dimension measures the velocity of HI along the line of sight.
Here, SlicerAstro generates a volume rendering of a galaxy in the Perseus-Pisces supercluster filament. The different colors highlight various intensity levels in the data. Grey, green, blue, and red correspond to three, eight, 15, and 20 times the root mean square noise, respectively.
In this case, two main components are visible. The first component is a central body. This body illustrates the regularly rotating disk of the galaxy. Three-dimensional warping results from the projected rotation of the disk. The second component is a tail of unsettled gas that results from tidal interaction with another galaxy. The tail relates to the rotating disk in terms of space and velocity.
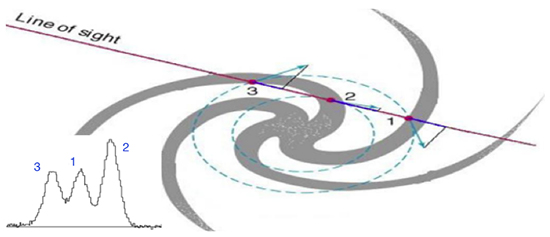
The 3D structure of the HI data is difficult to interpret for several reasons. The third axis of the data cube measures frequency. It is possible to convert frequency into velocity with the Doppler formula. The following image shows a galaxy with velocity components 1, 2, and 3 along the line of sight. The projection of the velocities along the line of sight and the corresponding Doppler shifts account for the observation of these components at different frequencies. For a given projection on the sky of a galaxy, geometric properties determine the precise projection of the velocity components, which dictate the kinematic information of the observation. Such properties include the inclination and the position angle of the semi-major axis as well as the distribution of gas along the line of sight. The projection of the velocity components of a rotating system then determines the 3D shape that SlicerAstro visualizes.
While SlicerAstro facilitates the analysis of typical HI data sets, astronomers still require training to interpret the 3D structure of the data and to get acquainted with the SlicerAstro tool itself. During this training process, interactivity is a key factor because it allows flexible viewing of the data.
Current Status of SlicerAstro
SlicerAstro is an open-source project that is currently available in the extensions manager of 3D Slicer. Although SlicerAstro is still under development, it already offers several stable features for the qualitative visualization and inspection of HI in galaxies. For example, SlicerAstro can import and save astronomical data in the Flexible Image Transport System (FITS) format [7]. SlicerAstro loads such data as AstroVolume data structures. These structures store 3D astronomical images, FITS headers, and information from the astronomical world coordinate system (WCS) [8,9].

SlicerAstro also displays quantitative information such as coordinate values and axes for two-dimensional views using the WCS.
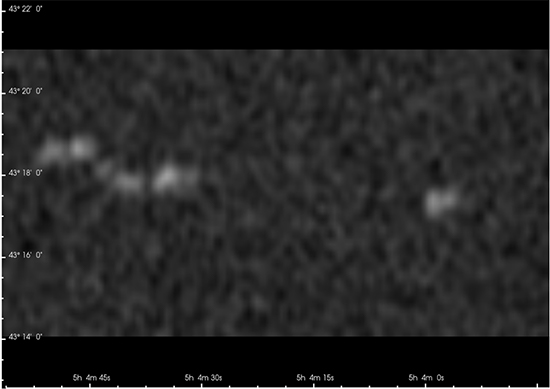
In addition, SlicerAstro optimizes interactive smoothing for HI data [10] that runs on multi-core CPUs, OpenMPs, graphical processing units, and OpenGL.
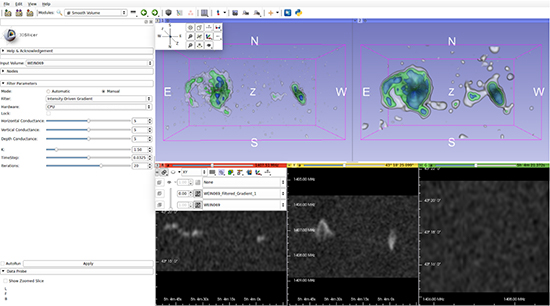
Next Step: Modeling and Comparative Visualization of HI in Galaxies
Interactively visualizing kinematic models (e.g., tilted-ring models that describe the rotation and geometry of HI) and data can help highlight asymmetries, extra-planar gas, tidal tails, and other special features. Changing model parameters and display parameters, for instance, can provide more effective comparisons of models and data.
![SlicerAstro displays NGC2403 HI data from the Things survey. The blue segmentation represents a tilted-ring model of the regularly rotating disk, which 3D Barolo automatically fit to the data [11]. The green segmentation highlights the part of the data that the most-suitable model does not represent.](https://www.kitware.com/main/wp-content/uploads/2016/07/NGC2403.jpg)
Conclusion
Although the development of SlicerAstro mainly focuses on 3D HI data, it is a useful tool for any other type of 3D astronomical data such as optical data. Please contact the authors or submit an idea to the issue tracker to provide feedback on how to improve AstroSlicer [3].
Acknowledgement
Support for SlicerAstro came from the European Research Council under the Seventh Framework Programme of the European Union (FP/2007-2013)/ERC Grant Agreement nr. 291-531. Support also came from Steve Pieper (Isomics, Inc.) and Andras Lasso (Laboratory of Percutaneous Surgery at Queen’s University) in the form of feedback and assistance.
References
[1] Oosterloo, Tom, Marc Verheijen, and Wim van Cappellen. “The latest on Apertif.” Proceedings of Science (2010): 43–53.
[2] Punzo, Davide, Thijs van der Hulst, Jos B.T.M. Roerdink, Tom Oosterloo, Mpati Ramatsoku, and Marc Verheijen. “The role of 3-D interactive visualization in blind surveys of HI in galaxies.” Astronomy and Computing 12 (2015): 86–99.
[3] Github, Inc. “Punzo / SlicerAstro.” https://github.com/Punzo/SlicerAstro.
[4] European Research Council and Kapteyn Astronomical Institute. “Documentation/Nightly/Extensions/SlicerAstro.” https://www.slicer.org/slicerWiki/index.php/Documentation/Nightly/Extensions/SlicerAstro.
[5] Fedorov Andrey, Reinhard Beichel, Jayashree Kalpathy-Cramer, Julien Finet, Jean-Christophe Fillion-Robin, Sonia Pujol, Christian Bauer, Dominique Jennings, Fiona Fennessy, Milan Sonka, John Buatti, Stephen Aylward, James V. Miller, Steve Pieper, and Ron Kikinis. “3D Slicer as an Image Computing Platform for the Quantitative Imaging Network.” Magnetic Resonance Imaging 30 (2012):1323–1341. pmid: 22770690.
[6] Serra, Paolo, Tobias Westmeier, Nadine Giese, Russell Jurek, Lars Flöer, Attila Popping, Benjamin Winkel, Thijs van der Hulst, Martin Meyer, Bärbel S. Koribalski, Lister Staveley-Smith, and Hélène Courtois. “SOFIA: a flexible source finder for 3D spectral line data.” Monthly Notices of the Royal Astronomical Society 448 (2015): 1922–1929.
[7] Pence, William D., Lucio Chiappetti, Clive G. Page, Richard Allen Shaw, and Elizabeth Stobie. “Definition of the Flexible Image Transport System (FITS), version 3.0.” Astronomy and Astrophysics 524 (2010): A42.
[8] Calabretta, Mark Raymond, and E. W. Greisen. “Representations of celestial coordinates in FITS.” Astronomy and Astrophysics 395 (2002): 1077–1122.
[9] Greisen, E.W., Mark Raymond Calabretta, Francisco Gabriel Valdes, and Stephen L. Allen. “Representations of spectral coordinates in FITS.” Astronomy and Astrophysics 446 (2006): 747–771.
[10] Punzo, Davide, Thijs van der Hulst, and Jos B. T. M. Roerdink.”Finding faint HI structure in and around galaxies: scraping the barrel.” Paper submitted to Astronomy and Computing, 2016.
[11] Di Teodoro, Enrico, and Filippo Fraternali. “3D BAROLO: a new 3D algorithm to derive rotation curves of galaxies.” Monthly Notices of the Royal Astronomical Society 451 (2015): 3021–3033.
 Davide Punzo is a doctoral student at the Kapteyn Astronomical Institute of the University of Groningen. His research interests not only include the domains of technology, computational sciences, and visualization, but they include the applications of these domains in astronomy.
 Thijs van der Hulst is a professor in radio astronomy at the Kapteyn Astronomical Institute of the University of Groningen. His expertise is in the structure and evolution of galaxies, with special focus on the relation of the interstellar gas component to star formation and the buildup of stellar mass in galaxies.
 Jos B.T.M. Roerdink received a Doctor of Philosophy in Theoretical Physics from Utrecht University in 1983. He currently is a professor and the director at the Johann Bernoulli Institute for Mathematics and Computer Science of the University of Groningen. There, he holds a chair in scientific visualization and computer graphics.
 Jean-Christophe Fillion-Robin is a technical expert and the lead developer of 3D Slicer at Kitware. He is also the lead developer of 3D Slicer for the National Alliance for Medical Image Computing (NA-MIC) community. As such, he developed the infrastructure for 3D Slicer extensions and worked on the port of 3D Slicer to Qt. He also co-created the open-source Common Toolkit (CTK).