Insitu Visualization using Ascent and ParaView

Ascent is an in-situ visualization and analysis library for HPC architectures (distributed computing) with support for many-core nodes (such as GPUs) through VTK-m. Ascent enables users to visualize simulation data through actions declared in a json or yaml file. Types of actions include creating images, extracting data, transforming data, evaluating expressions and executing actions based on a condition. One of the options when extracting data is executing a Python script to process that data.
We use this option, to offer an alternative way to visualize simulation data (for simulations instrumented with Ascent) using a ParaView Python script. We created ParaView visualization scripts for all example simulations provided with Ascent. In the rest of this document we describe the ParaView visualization script for one of them cloverleaf3d. To try this code, follow the instructions in the Ascent documentation to install Ascent and ParaView using spack, configure and run cloverleaf3d and visualize the results using a ParaView pipeline. Next, we describe this ParaView pipeline and the configuration file needed.
First we need to tell Ascent that we are using a Python script to visualize data using a file called ascent-actions.json.
[
  {
    "action": "add_extracts",
    "extracts":
    {
      "e1":
      {
        "type": "python",
         "params":
         {
           "file": "paraview-vis.py"
         }
       }
    }
  }
]
The ParaView pipeline for the cloverleaf3d sample integration is in paraview-vis.py.
In this script, we use a variable count to be able to distinguish when this script is called for the first time, when we have to setup the visualization pipeline. Every time the script is called we execute the visualization pipeline we’ve setup.
try:
    count = count + 1
except NameError:
    count = 0
The first time the script is called we initialize ParaView,
if count == 0:
    import paraview
    paraview.options.batch = True
    paraview.options.symmetric = True
then we load the AscentSource plugin and we create the object that converts the simulation data to a VTK dataset. We also create a view of the same size as the image we want to save.
    LoadPlugin("@PARAVIEW_ASCENT_SOURCE@", remote=True, ns=globals())
    ascentSource = AscentSource()
    view = CreateRenderView()
    view.ViewSize = [1024, 1024]
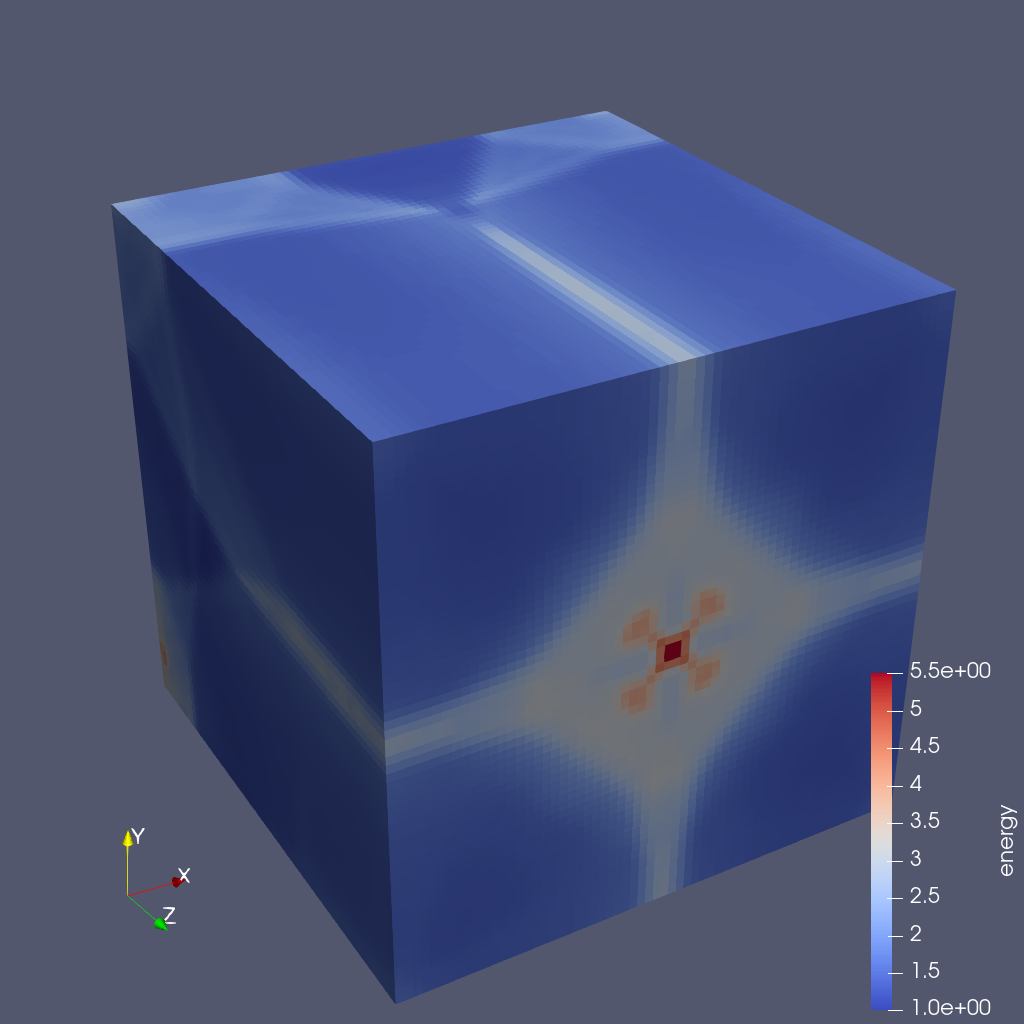
From the VTK dataset, we select only the cells that are not ghosts, and show them colored by the energy scalar. Note that for a ParaView filter that has no input specified, the output data from the previous filter in the pipeline is used. So SelectCells uses the output data from ascentSource.
    sel = SelectCells("vtkGhostType < 1")
    e = ExtractSelection(Selection=sel)
    rep = Show()
    ColorBy(rep, ("CELLS", "energy"))
We rescale the transfer function, show a scalar bar, and change the viewing direction
    transferFunction = GetColorTransferFunction('energy')
    transferFunction.RescaleTransferFunction(1, 5.5)
    renderView1 = GetActiveView()
    scalarBar = GetScalarBar(transferFunction, renderView1)
    scalarBar.Title = 'energy'
    scalarBar.ComponentTitle = ''
    scalarBar.Visibility = 1
    rep.SetScalarBarVisibility(renderView1, True)
    cam = GetActiveCamera()
    cam.Elevation(30)
    cam.Azimuth(-30)
For all timesteps, UpdateAscentData sets the new Ascent data and marks the VTK source as modified. This insures that a new VTK dataset will be computed when we need to Render. We also call UpdatePropertyInformation which insures that property values are available to the script. There are two properties available on AscentSource: Time (this represents the simulation time and is the same as state/time in Conduit Blueprint Mesh specification) and Cycle (this represents the simulation time step when the visualization pipeline is called and is the same as state/cycle in Conduit Blueprint Mesh specification). After that, we ResetCamera so that the image fits the screen properly, we render, and we save the image to a file.
ascentSource.UpdateAscentData()
ascentSource.UpdatePropertyInformation()
cycle = GetProperty(ascentSource, "Cycle").GetElement(0)
rank = GetProperty(ascentSource, "Rank").GetElement(0)
imageName = "image_{0:04d}.png".format(int(cycle))
ResetCamera()
Render()
SaveScreenshot(imageName, ImageResolution=(1024, 1024))
This script saves an image for each cycle with the image for cycle 200 shown next.

Implementation details
The Ascent ParaView integration is implemented in the src/examples/paraview-vis directory in the Ascent distribution.
The AscentSource class, found in paraview_ascent_source.py, derives from VTKPythonAlgorithmBase and produces one of the following datasets depending on the simulation data: vtkImageData, vtkRectilinearGrid, vtkStructuredGrid or vtkUnstructuredGrid. AscentSource receives from an instrumented simulation a tree structure (json like) that describes the simulation data using the Conduit Blueprint Mesh specification. This data is converted to a VTK format using zero copy for data arrays.
Global extents are not passed for the existing example integrations so they are computed (using MPI communication) for uniform and rectilinear topologies but they are not computed for a structured topology (lulesh integration example). This means that for lulesh and datasets that have a structured topology we cannot save a correct parallel file that represents the whole dataset, unless the global extents are passed from the simulation.
A ParaView pipeline for each sample simulation is specified in a paraview-vis-XXX.py file where XXX is the name of the simulation. In this file, we load the ParaView plugin and setup the pipeline the first time the script is called and update the pipeline and save a screenshot for each timestep of the simulation.
Acknowledgement
This research was supported by the Exascale Computing Project (17-SC-20-SC), a joint project of the U.S. Department of Energy’s Office of Science and National Nuclear Security Administration, responsible for delivering a capable exascale ecosystem, including software, applications, and hardware technology, to support the nation’s exascale computing imperative.