Computing Gradients in ParaView for Datasets with Different Cell Dimensions
In scientific visualization, gradient computations vary based on the use case. For use cases with shallow water simulations or free surface simulations, cells of different dimensions should contribute to the computations in some manner. For other use cases, cells of different dimensions should not contribute to the computations.
ParaView, a very general tool for analyzing and visualizing data, can compute gradients. This article examines two use cases of ParaView. Both use cases rely on the Calculator filter to generate a Point Data field from input. The use cases then apply the GradientOfUnstructuredDataSet filter to compute results.
Use Case 1
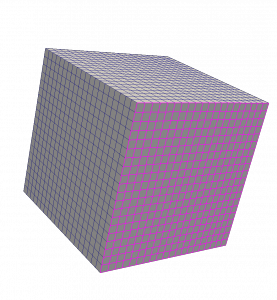
The first use case employs a dataset that has both two-dimensional (2D) and three-dimensional (3D) cells, where the 2D cells serve as the faces of a subset of the 3D cells.
ParaView generates a Point Data field from the dataset, using the Calculator filter and the following input: coordsX+coordsY+coordsZ. When the GradientOfUnstructuredDataSet filter is applied to the Point Data field, the expected result is a tuple of [1, 1, 1] throughout the dataset. Since 2D cells incorrectly contribute to the computation, however, the gradient is wrong where 2D cells are present.
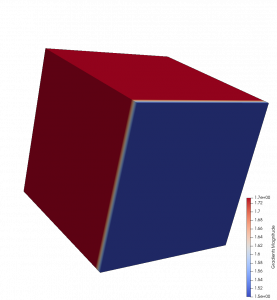
A new feature of GradientOfUnstructuredDataSet produces the expected result. This feature, called ContributingCellOption, helps to control what cells contribute to the computation. Note that this is an advanced feature; by default, it will not be visible in the GradientOfUnstructuredDataSet options in the graphical user interface of ParaView.
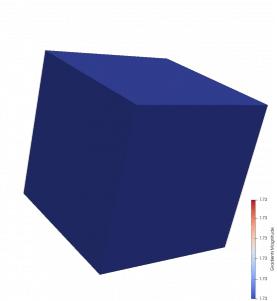
There are three enumerations for ContributingCellOption: DataSetMax, All and Patch. The default, DataSetMax, only uses cells with the highest dimension in a dataset to compute gradient quantities. Unlike DataSetMax, All uses each cell in the dataset to compute gradient quantities. This option provides the behavior for ParaView 5.4 and earlier. Alternatively, Patch only considers cells that contribute to the local gradient computation. From these cells, Patch selects those with the highest dimension.
Use Case 2
Another use case employs a dataset in which 3D cells are present in one part of the domain, and 2D cells are present in another part. To be clear, these parts are connected.
For this use case, coordsX*coordsX+coordsY*coordsY+coordsZ*coordsZ serves as the input to the Calculator filter. While the Points Data field that the filter generates is slightly more interesting than the one in the previous example, a numerical result from this use case can still be compared to an analytical result. Here are the results for the X-component, the Y-component and the Z-component of the gradient.
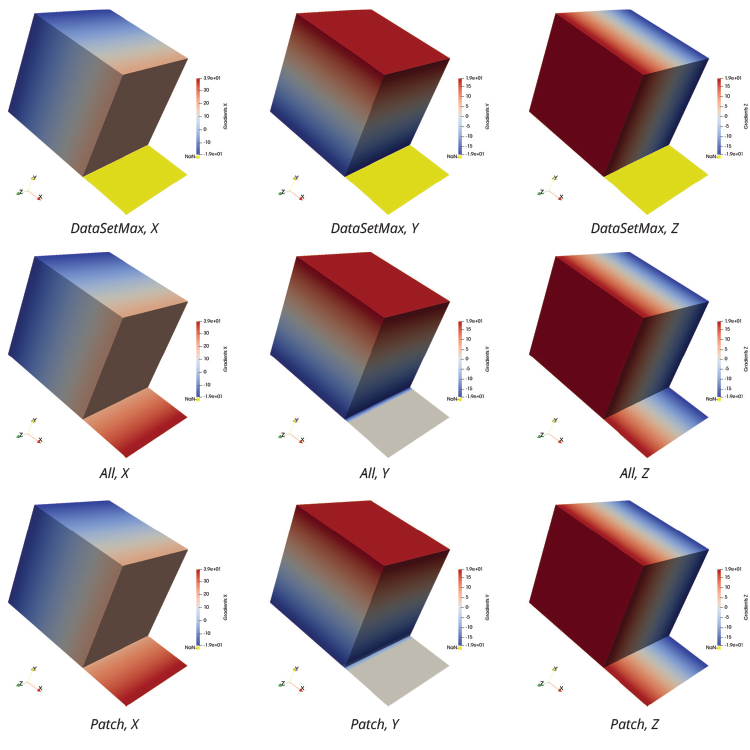
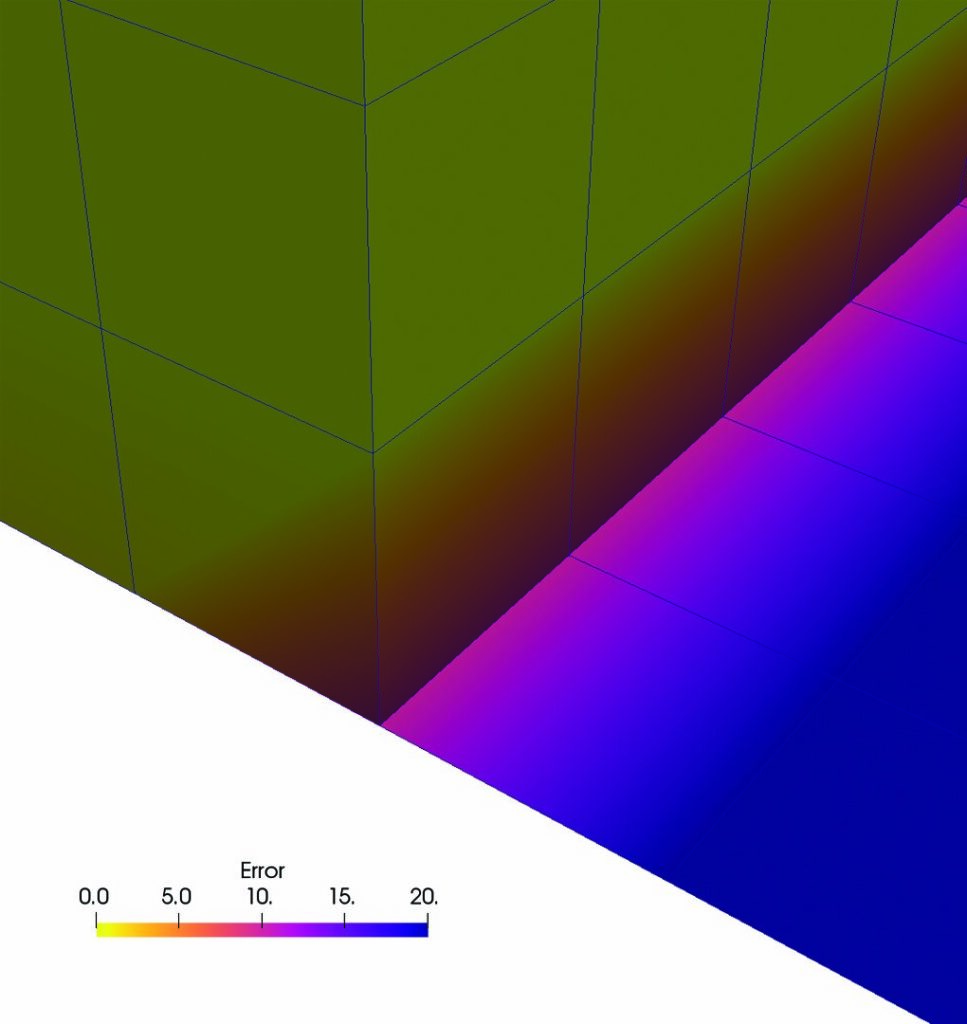

The results of DataSetMax are likely not desired in this case, as the filter produces Not-a-Number (NaN) values over the 2D cells. This is shown by the yellow pseudocoloring in the above images. While All and Patch give the expected results for the X-component and the Z-component, the results for the Y-component call for further analysis. This analysis can be performed by comparing the numerical result of the Y-component for each computation with the analytical result of 2*coordsY. The Calculator filter can make this comparison using the abs(Gradients_Y-2*coordsY) expression, if “Error” is designated in the field for Result Array Name.
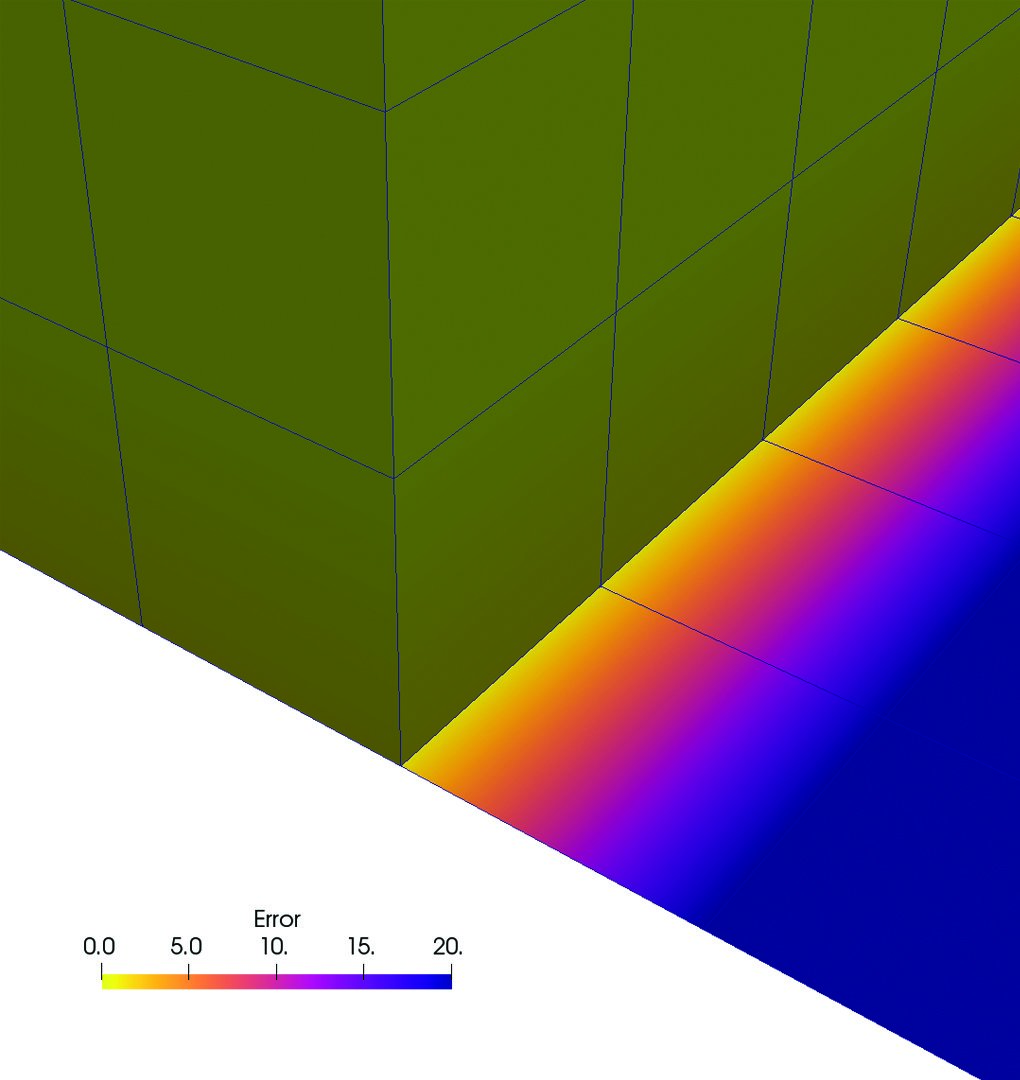
The images on the right show the results of All and Patch pseudocolored by “Error.” In the top image, All produces an error in 3D cells that use the same points as 2D cells. Patch does not produce this error, as the bottom image demonstrates. This result is expected, as Patch ignores contributions from 2D cells for points that are connected to 3D cells.
In addition, both All and Patch produce an error in 2D cells. Since 2D cells are located in the XZ-plane, there is no depth in the Y-direction. Therefore, there is no variation in the Y-direction, and the computed Y-component of the gradient is zero.
In light of the fact that this use case does not have valid values for all gradient quantities, another new feature of GradientOfUnstructuredDataSet comes into play. This feature is called ReplacementValueOption. Like ContributingCellOption, ReplacementValueOption is an advanced feature. Its enumerations are NaN, which is the default; Zero; DataTypeMin; and DataTypeMax. For this use case, the results for NaN should trigger the realization that something is amiss with the ContributingCellOption results. A possible solution is to threshold out the cells with NaN values.
Acknowledgment
The datasets for both use cases are available at https://data.kitware.com/#folder/5a1c85008d777f7ddd99ab8b. While this article explores the datasets in ParaView, the new features of GradientOfUnstructuredDataSet come from vtkGradientFilter in the Visualization Toolkit (VTK). For backwards compatibility, the default behavior for vtkGradientFilter uses the All option in ContributingCellOption.
The work in VTK and ParaView was funded by Sandia National Laboratories. In particular, Ken Moreland from Sandia took part in discussions on how to improve gradient computation with VTK and ParaView for a variety of use cases.
Sandia National Laboratories is a multimission laboratory managed and operated by National Technology and Engineering Solutions of Sandia, LLC., a wholly owned subsidiary of Honeywell International, Inc., for the U.S. Department of Energy’s National Nuclear Security Administration under contract DE-NA0003525.
 Andrew Bauer is a staff R&D engineer on the high-performance computing (HPC) and visualization team at Kitware. He primarily works on enabling tools and technologies for HPC simulations.