CFD post-processing with ParaView – A practical case in wind engineering : impact of tornado wind on buildings
This is a guest blog from Matthieu Morel from NEMOSFLOW, specialized in Computational Fluid Dynamics for industry and R&D.
Introduction to post-processing CFD results: a crucial step
Usually, the Computational Fluid Dynamics (CFD) workflow is composed of three main steps :
- Pre-processing : problem analysis, geometry, mesh building and setup solver
- Processing with CFD software
- Post-processing. Once simulations are realized, it is mandatory to analyze and interpret the obtained results. To do this, CFD engineers sometimes have to process large amounts of data, in order to validate hypotheses, to perform post-processing calculations and to build relevant visualization (graphs, maps, etc.).
ParaView is a powerful open source software fulfilling all post-processing step requirements. It proposes many functionalities to easily manipulate and visualize data, and the possibility to include python scripts for user driven automation. In addition, it is possible to generate high quality renderings, an important feature in visualization nowadays.
In what follows, an overview of some useful CFD tools and tips available with ParaView are presented through a project focused on tornado impact on buildings.
Project context
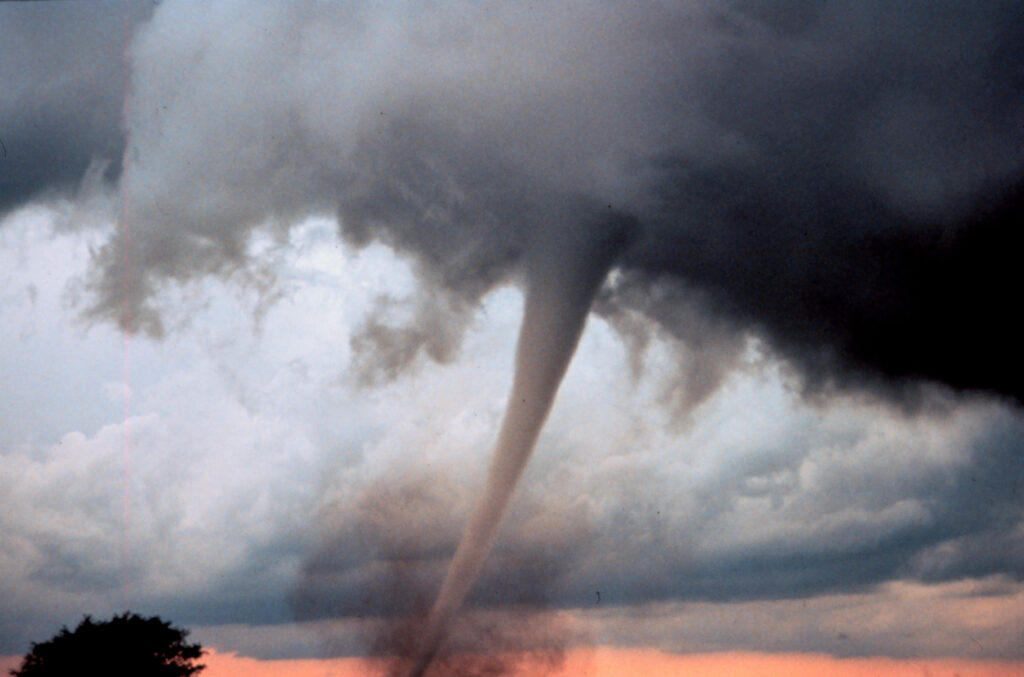
Wind impact on structures (buildings, bridges, towers) is a subset of wind engineering, which analyses wind effects in constructed environments with the objective to study possible damage resulting from wind. Currently, in the civil engineering world, it is mostly evaluated with a prescriptive methodology such as Eurocode1. However, it is sometimes necessary to have more detailed results for example when local or unsteady effects become non-negligible, especially in complex or sensitive configurations. CFD is one way to achieve this.
In the configuration presented here, a tornado is crossing an urban area. CFD allows to take into account some particularities of the situation :
- The tornado moves over time
- Wind direction and its intensity changes over time
- Pressure evolution depends of two factors : direct wind effects, and pressure drop caused by the tornado
Usually, important results concern pressure coefficient on buildings, defined as :
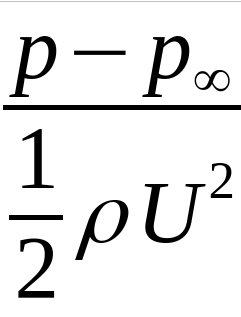
where p is pressure, p∞ is undisturbed flow static pressure, ρ is density and U is characteristic velocity.
Modeling & settings
Modeling is summarized in Figure 2. Gyration and tornado displacement are imposed with lateral and top boundary conditions. Inflow comes from lateral boundary condition, while outflow is evacuated on top boundary condition.
The tornado was modeled first in a static initial position. Then, a second simulation was realized with boundary conditions depending on time, to move the vortex across the domain.

In this work, desired results about pressure coefficients only concern dynamic effects from wind. Consequently, pressure drop resulting from the presence of the vortex has to be removed. To achieve this, two configurations were simulated :
- The tornado’s passage on the real site
- The tornado’s passage on an empty domain, without buildings
This way, with some manipulations available with ParaView (cf. below), it was possible to extract results needed.
All simulations were realized with code_saturne2, an open source CFD software developed by EDF R&D.
Visualization with specific features of ParaView
The ParaView’s simulation post-processing looks like Figure 3. It shows an overview of the Graphical User Interface with the realized pipeline, composed of substantial quantity of filters and manipulations. Mains steps of this pipeline are resumed in Figure 4.
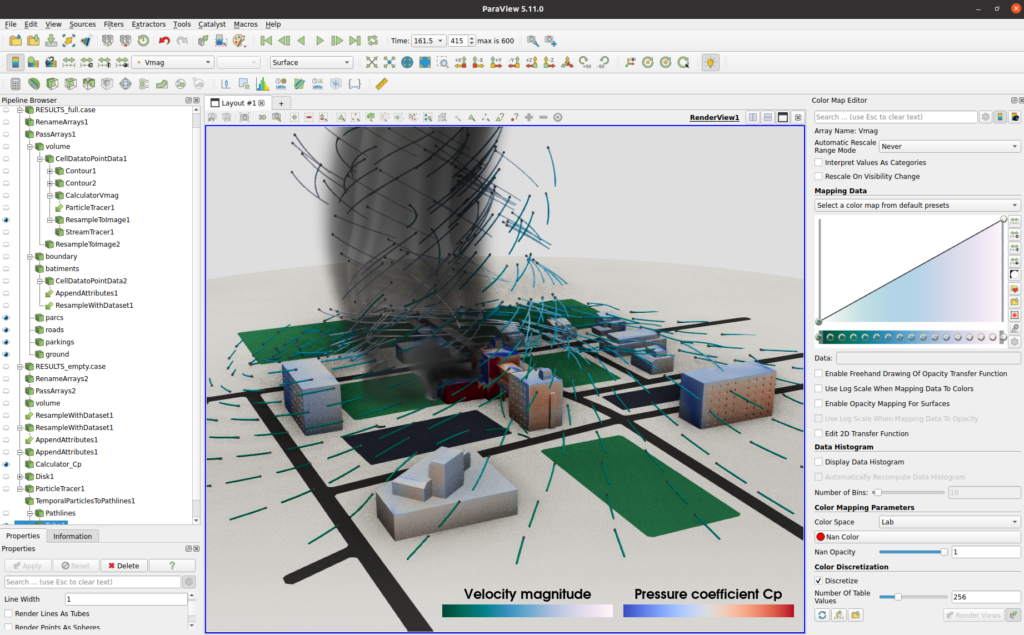

Figure 4 shows the main steps of the pipeline constructed with ParaView. Blue boxes correspond to the 2 simulated configurations (the « real » case with the urban area, and the « empty » case without buildings in the domain). Yellow boxes are basic ParaView filters and are not detailed here. Finally, a focus is done on filters shown in red, which provide very interesting features :
- The ResampleWithDataset filter allows to sample point and cell data of one dataset onto points of another one. In the presented work, it was used in order to project obtained pressure in the « empty » case at the surface of buildings in the « real » case, as shown in Figure 5.
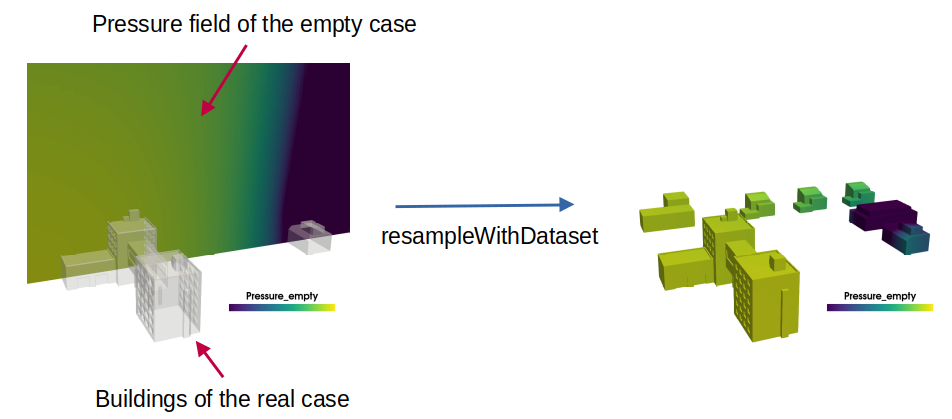
- It was then possible to define an AppendAttributes filter between the buildings surface results and the previously realized resample, in order to group together the two pressure fields in one dataset. This way, pressure coefficient Cp corresponding to wind effects could now be defined thanks to a calculator filter, and visualized.
- The particlesTracer filter creates fictive massless particles with animation over time according to the wind velocity field. With the addition of the TemporalParticlesToPathLines filter, it is possible to visualize paths behind these particles, with a given length.
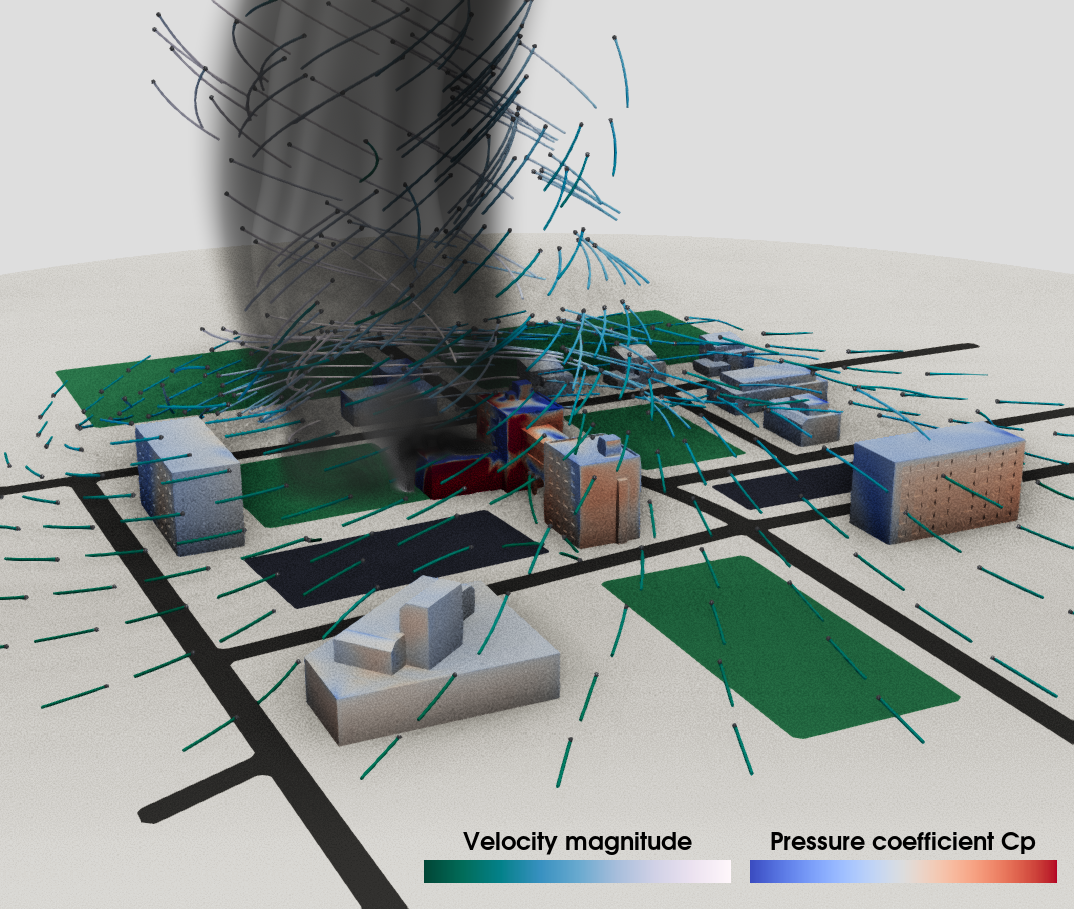
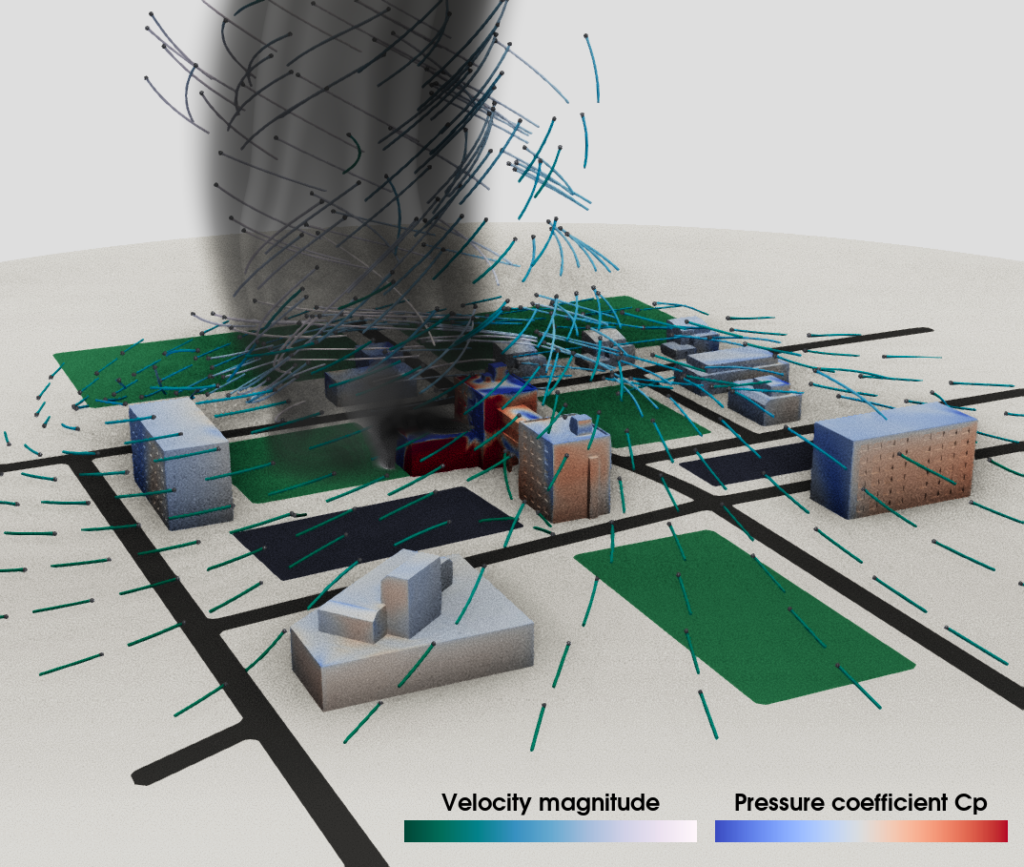
A final resulting visualization looks like Figure 6. All relevant information is available with high quality rendering:
- Pressure Iso-Contours define the tornado
- Cp map allows to determine exposed parts of buildings
- Particles paths illustrates the flow around buildings
Acknowledgments
This article was jointly written with Matthieu Morel from NEMOSFLOW, specialized in Computational Fluid Dynamics for industry and R&D.
For further information :
Author’s profile : https://www.linkedin.com/in/matthieu-morel-nemosflow
Company’s website : https://nemosflow.com

References
- Eurocode 1: Actions on structures — Part 1-4: General actions — Wind actions, NF EN 1991-1-4, 2005. ↩︎
- Frédéric Archambeau, Namane Méchitoua and Marc Sakiz, ‘Code_Saturne: a Finite Volume Code for the Computation of Turbulent Incompressible Flows’, International Journal on Finite Volumes, volume 1, 2004. ↩︎