Atomic Structures in Tomviz

Tomviz is a cross platform, open source application for the processing, visualization, and analysis of 3D tomographic data. Here the full pipeline of data processing steps from reconstruction to visualization to analysis of 3D data can be presented, saved, and restored. A suite of Python tools for 3D analysis is packaged to accommodate custom algorithms. Tomviz is tested and packaged on Windows, macOS, and Linux.
We have developed a new feature to enable the use of Tomviz by researchers employing atom probe tomography and atomic electron tomography. The main addition is the ability to work with atomic structures extracted from atom probe tomography and atomic electron tomography data sets. This practically means that you can load atomic data from files on disk, or output atomic structure from volumetric data as part of an atom segmentation operator.
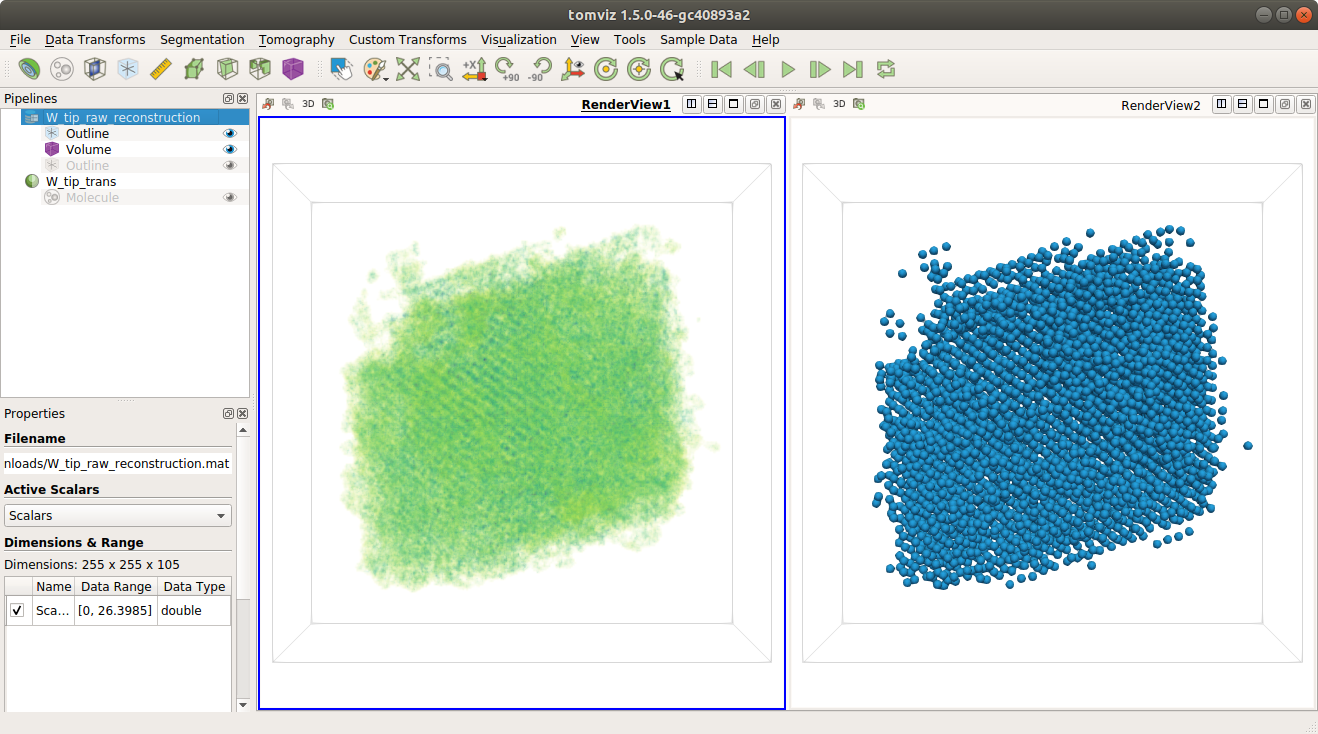
We are pleased to announce that starting from Tomviz 1.5 we are shipping initial support for displaying atomic structures, with the screenshot below showing an atomic electron tomography data set (left), and the segmented atomic positions (right). This data comes courtesy of the Miao Group, described in their publication, “Three-dimensional coordinates of individual atoms in materials revealed by electron tomography“.

There are two ways to add a molecule to the scene:
1. Opening a chemical file
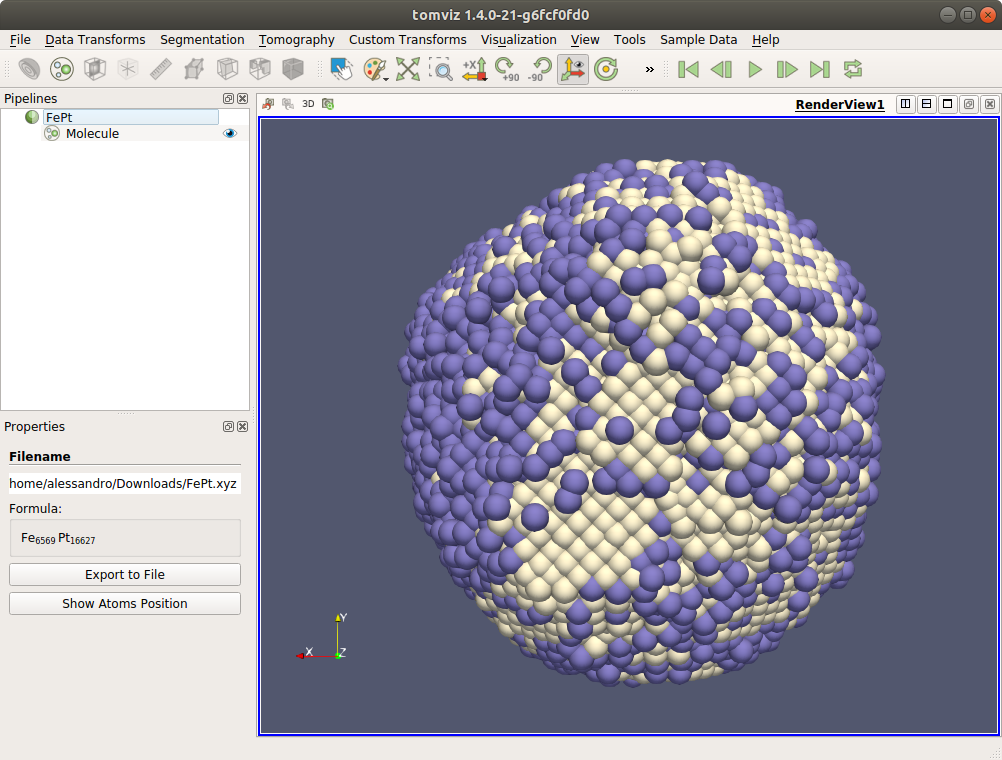
Opening chemical files directly will add a molecule module in the active scene. Right now this uses the XYZ format, adding more formats is straightforward and planned for the future.
2. Returning a molecule as the result of an operator
With the latest changes, if an operator in the pipeline returns a vtkMolecule as its result, Tomviz will display it in the scene.
This means that you can now perform the whole Projection -> Reconstruction -> Atomc Positions pipeline in Tomviz and immediately visualize the result.
Below is an example of a trivial custom Python operator that outputs a molecule (in this case unrelated to the volume):
import numpy as np
import vtk
import tomviz.operators
import tomviz.utils

class DummyMoleculeOperator(tomviz.operators.CancelableOperator):

    def transform_scalars(self, dataset):
        """Output atomic positions"""

        atomic_numbers = [1, 1]
        positions = [
            0, 0, 0,
            1, 0, 0
        ]
        molecule = vtk.vtkMolecule()

        for i in range(len(atomic_numbers)):
            pos = np.array(positions[i * 3:i * 3 + 3])
            molecule.AppendAtom(atomic_numbers[i], pos[0], pos[1], pos[2])

        return {"molecule": molecule}
The Tomviz project is developed as part of a collaboration between Kitware and the University of Michigan under DOE Office of Science contract DE-SC0011385. This is a community project, and we are very pleased to take input and contributions from all in the community.